
A hands-on options curriculum covering real trading concepts. Read the lessons, work through examples, and test your knowledge.
OVERALL ACADEMY PROGRESS
Free Lesson
Every lesson is free to read. Subscribe to add Signal Desk, progress tracking, PDF downloads and the lesson tutor.
Lesson 12: 4.11: Backtesting Technical Indicators & False Signal Filtering
Understand backtesting methodologies, performance metrics, and filtering techniques to reduce drawdown.
1. Scientific Backtesting & Overfitting Risks
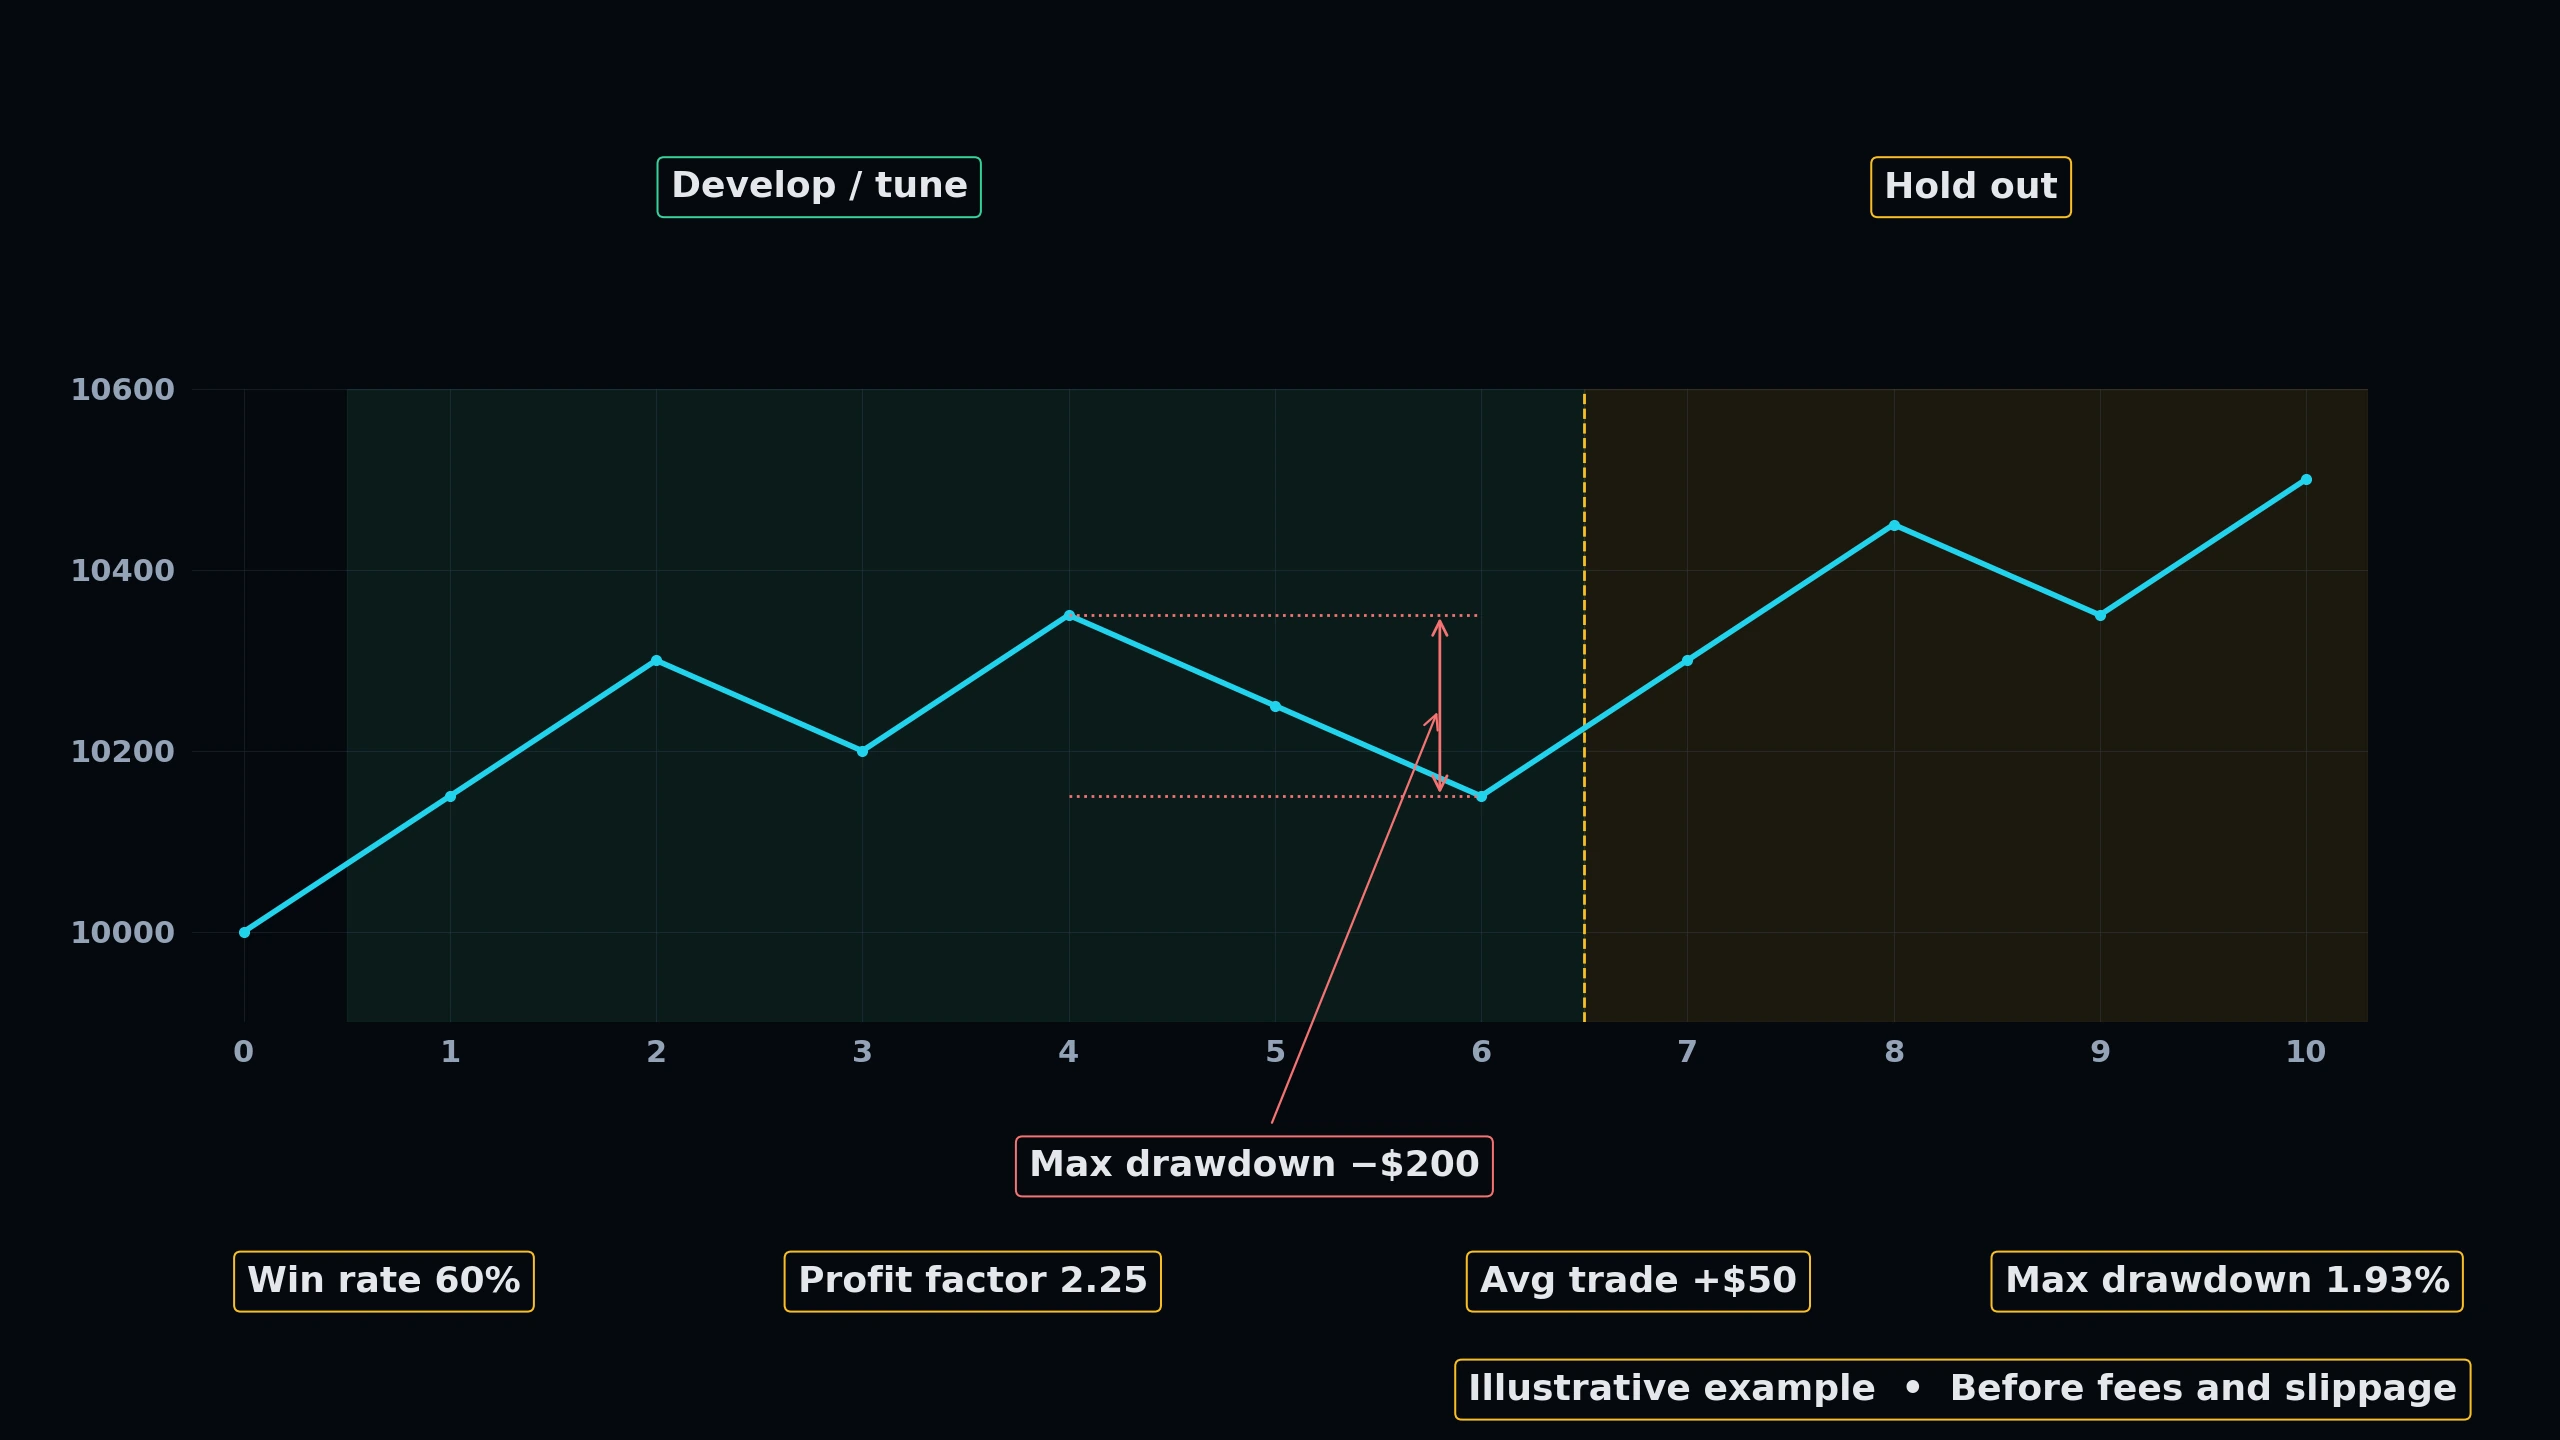
Backtesting is the process of applying trading rules to historical price data to evaluate performance. Crucial metrics include Win Rate, Profit Factor, Sharpe Ratio, and Maximum Drawdown.
A common mistake is curve-fitting (overfitting), where indicators are adjusted too specifically to match past data, rendering the strategy completely useless in real-time live trading.
★ Performance Tip: Always use out-of-sample data (unseen historic periods) to validate backtest strategies before risking live capital.
 Click to enlarge
Technical Market Structure Blueprint
Interactively map key institutional Price Action patterns. Switch between the 4 technical blueprints below and click the glowing blue hotspots to dissect the market mechanics.
Pattern Technical Explainer
Select any glowing node on the technical chart to inspect the institutional structure details.
KNOWLEDGE RECONNAISSANCE
What is the danger of 'curve-fitting' (overfitting) during indicator backtesting?
More lessons in this module
- 4.0: Foundations of Price Action & Candlestick Anatomy
- 4.1: Support and Resistance Zones vs. Single Lines
- 4.2: Trendlines, Channels, and Structural Breakouts
- 4.3: Volume Analysis & Volume Profile (VPVR/POC)
- 4.4: Simple & Exponential Moving Averages (SMA/EMA)
- 4.5: Oscillator Mechanics: RSI and Stochastic Indicators
- 4.6: Trend Strength Indicators: MACD and ADX
- 4.7: Volatility Bands: Bollinger Bands & ATR
- 4.8: Classical Chart Patterns: Double Tops, Head & Shoulders
- 4.9: Fibonacci Retracements, Extensions & Golden Ratio
- 4.10: Multi-Timeframe Analysis & Confluence Modeling
Signal Desk is where you practice this on real stocks: real option chains (about 15 minutes delayed), the Trade Check and a paper-trading account that risks no real money. Join to add it, your progress tracking and PDF downloads.