
A hands-on options curriculum covering real trading concepts. Read the lessons, work through examples, and test your knowledge.
OVERALL ACADEMY PROGRESS
Free Lesson
Every lesson is free to read. Subscribe to add Signal Desk, progress tracking, PDF downloads and the lesson tutor.
Lesson 9: 4.8: Classical Chart Patterns: Double Tops, Head & Shoulders
Recognize structural reversal and continuation chart patterns, including breakout and target rules.
1. Structural Reversals
Classical chart patterns reflect the struggle between buyers and sellers at key psychological structures. Reversal patterns include Double Tops (rejection of a high twice, breaking the 'neckline' support) and Head & Shoulders (three successive peaks, with the middle peak being the highest).
Continuation patterns include Flags and Pennants, which represent healthy consolidation pauses before the asset resumes its original primary trend direction.
★ Execution Rule: Never frontrun a pattern; entry signals require a candle close outside the breakout trigger neckline.
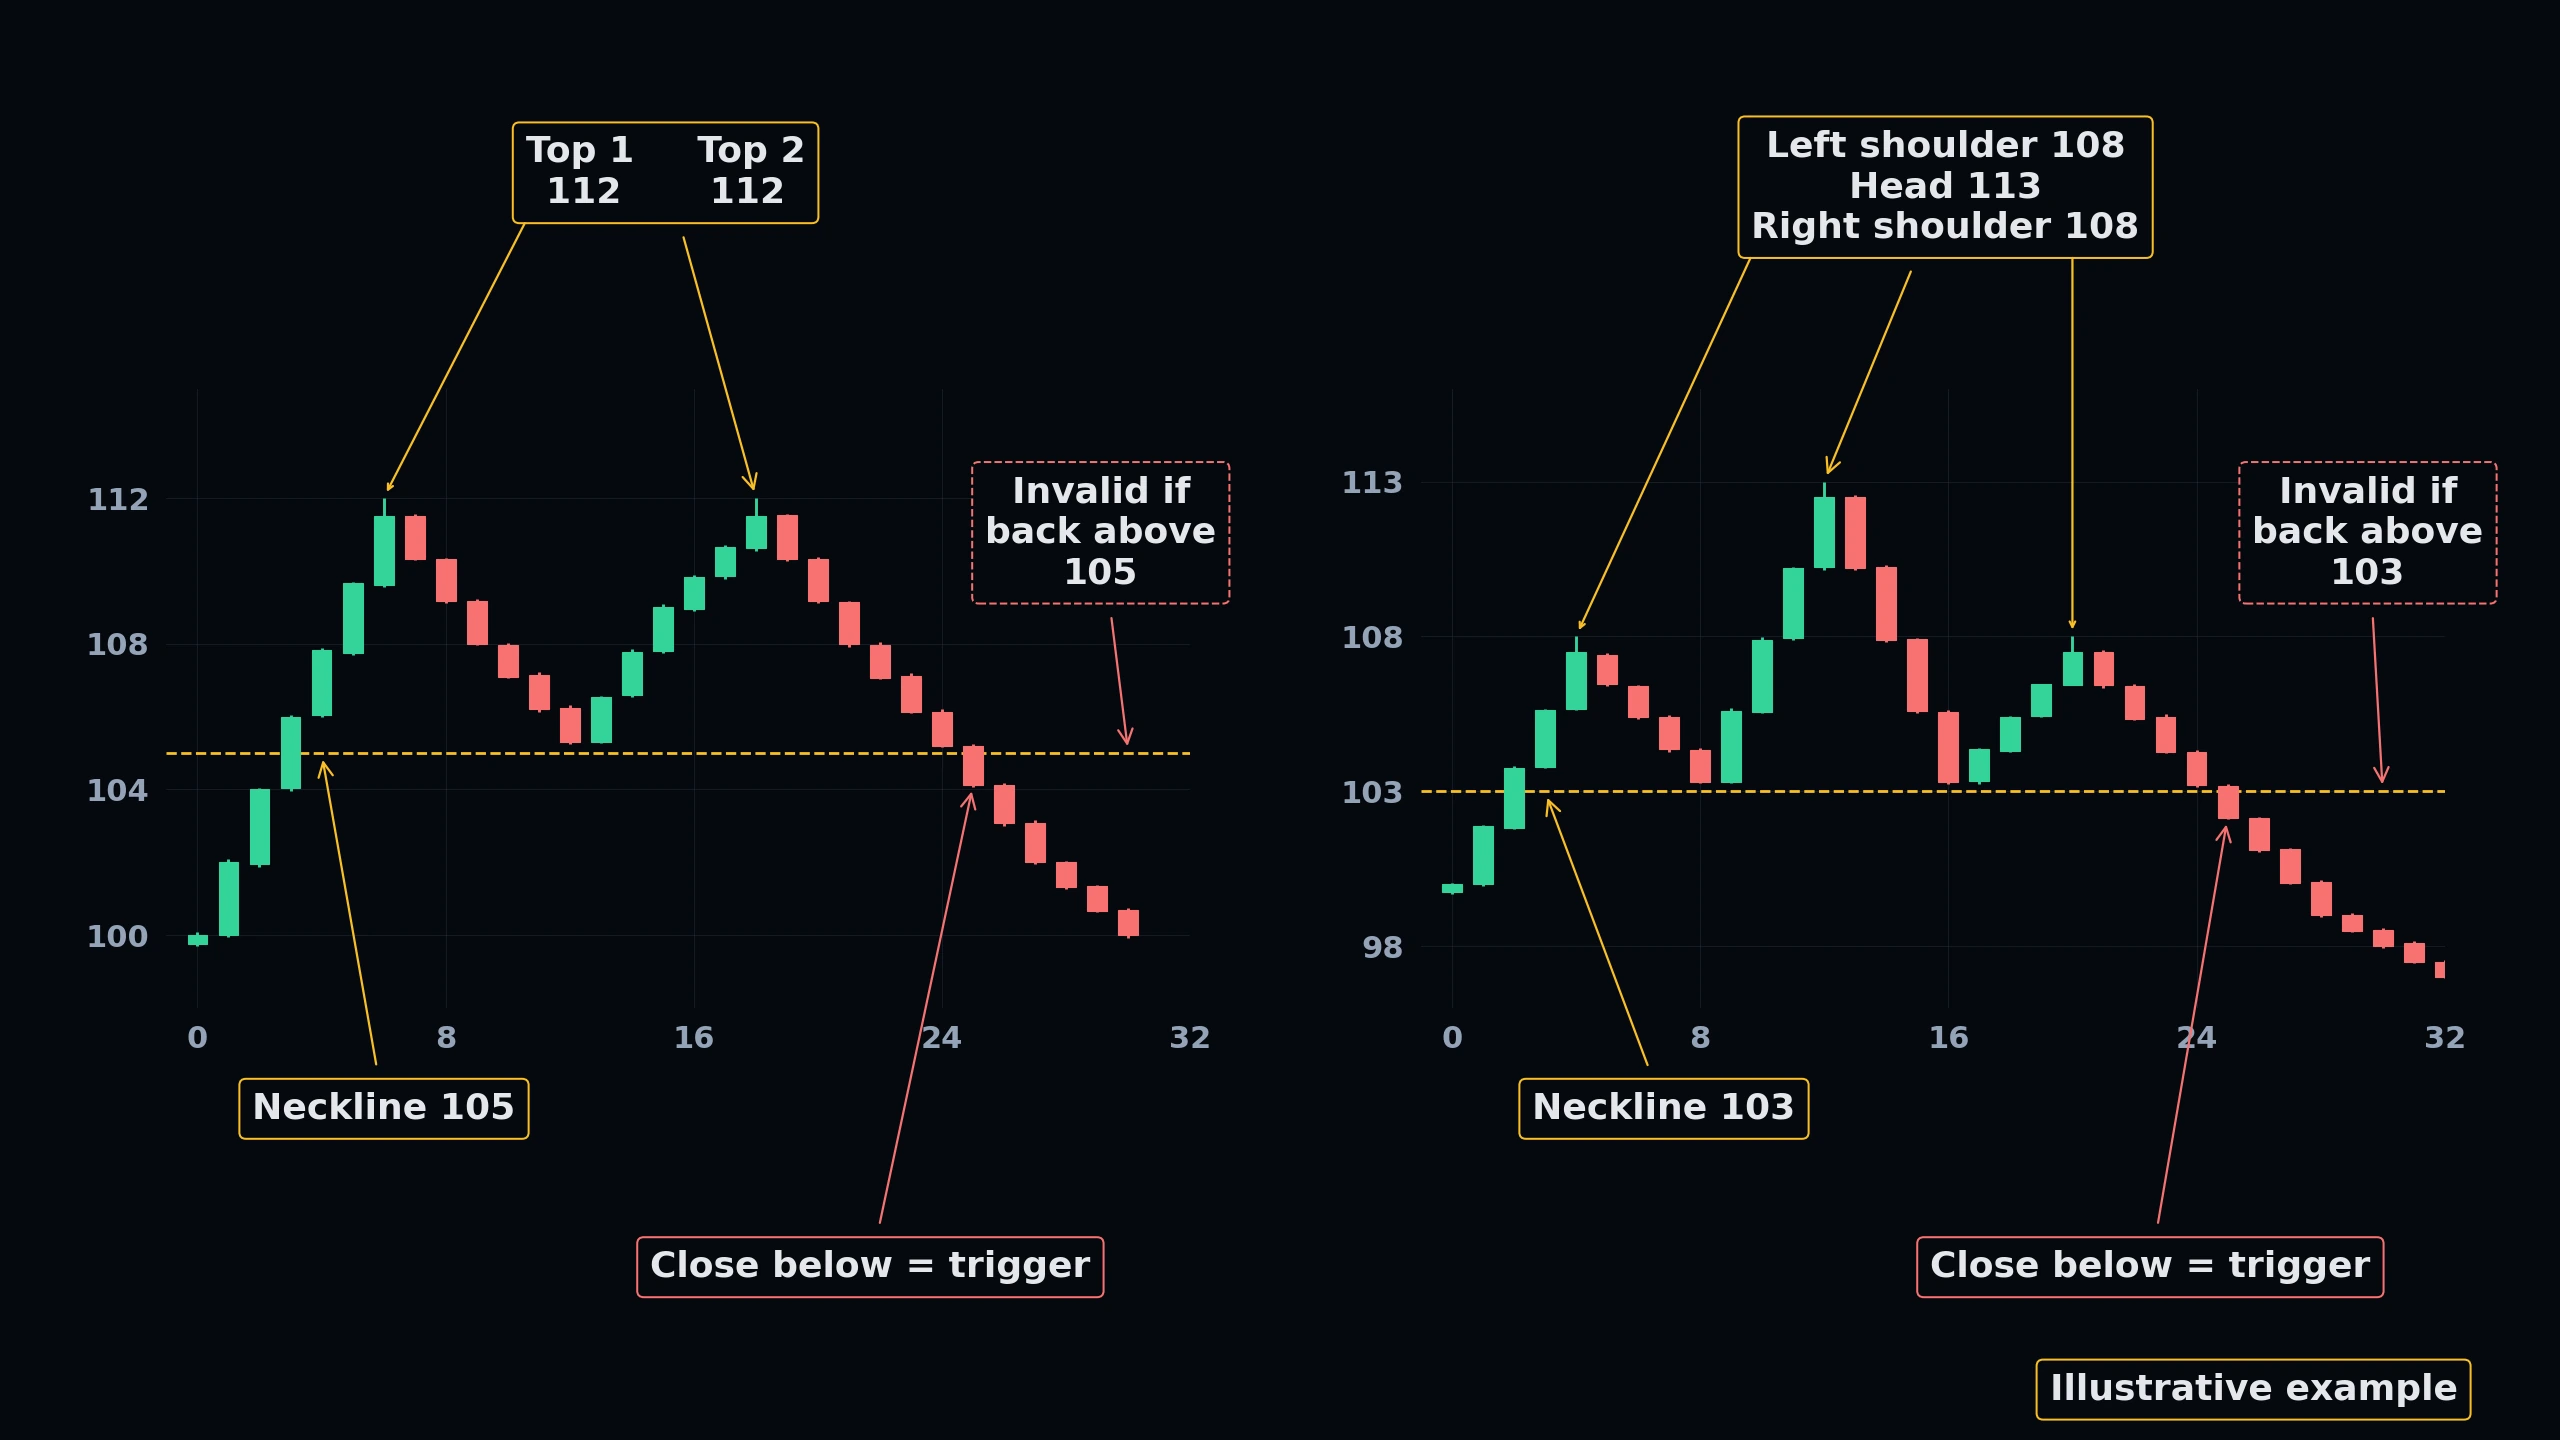 Click to enlarge
Capital Velocity & Time Horizons
Option success requires aligning your time horizon with appropriate capital velocity. Complete the 5 strategic trade preparation steps below to validate your execution plan.
Capital Velocity Comparison
Tactical Setup Validation & Trade Preparation
Formulate Directional Bias
Analyze daily EMAs and market structure context on TradingView.
Assess Implied Volatility (IV) Rank
High IV Rank flags premium selling setups; low IV Rank flags buying opportunities.
Select Expiration Horizon
30-45 DTE for decay speed sweet spot, or LEAPs for passive equity proxies.
Structure Option Strategy
Choose single long/short legs or credit spreads to contain collateral.
Align Sizing & Position Risk
Cap single position risk at 2% total account equity and define loss gates.
KNOWLEDGE RECONNAISSANCE
What is the trigger point for entering a trade based on a Head and Shoulders pattern?
More lessons in this module
- 4.0: Foundations of Price Action & Candlestick Anatomy
- 4.1: Support and Resistance Zones vs. Single Lines
- 4.2: Trendlines, Channels, and Structural Breakouts
- 4.3: Volume Analysis & Volume Profile (VPVR/POC)
- 4.4: Simple & Exponential Moving Averages (SMA/EMA)
- 4.5: Oscillator Mechanics: RSI and Stochastic Indicators
- 4.6: Trend Strength Indicators: MACD and ADX
- 4.7: Volatility Bands: Bollinger Bands & ATR
- 4.9: Fibonacci Retracements, Extensions & Golden Ratio
- 4.10: Multi-Timeframe Analysis & Confluence Modeling
- 4.11: Backtesting Technical Indicators & False Signal Filtering
Signal Desk is where you practice this on real stocks: real option chains (about 15 minutes delayed), the Trade Check and a paper-trading account that risks no real money. Join to add it, your progress tracking and PDF downloads.