
A hands-on options curriculum covering real trading concepts. Read the lessons, work through examples, and test your knowledge.
OVERALL ACADEMY PROGRESS
Free Lesson
Every lesson is free to read. Subscribe to add Signal Desk, progress tracking, PDF downloads and the lesson tutor.
Lesson 5: 4.4: Simple & Exponential Moving Averages (SMA/EMA)
Understand price smoothing, trends filters, crossovers, and the difference between SMA and EMA.
1. SMA vs. EMA Mechanics
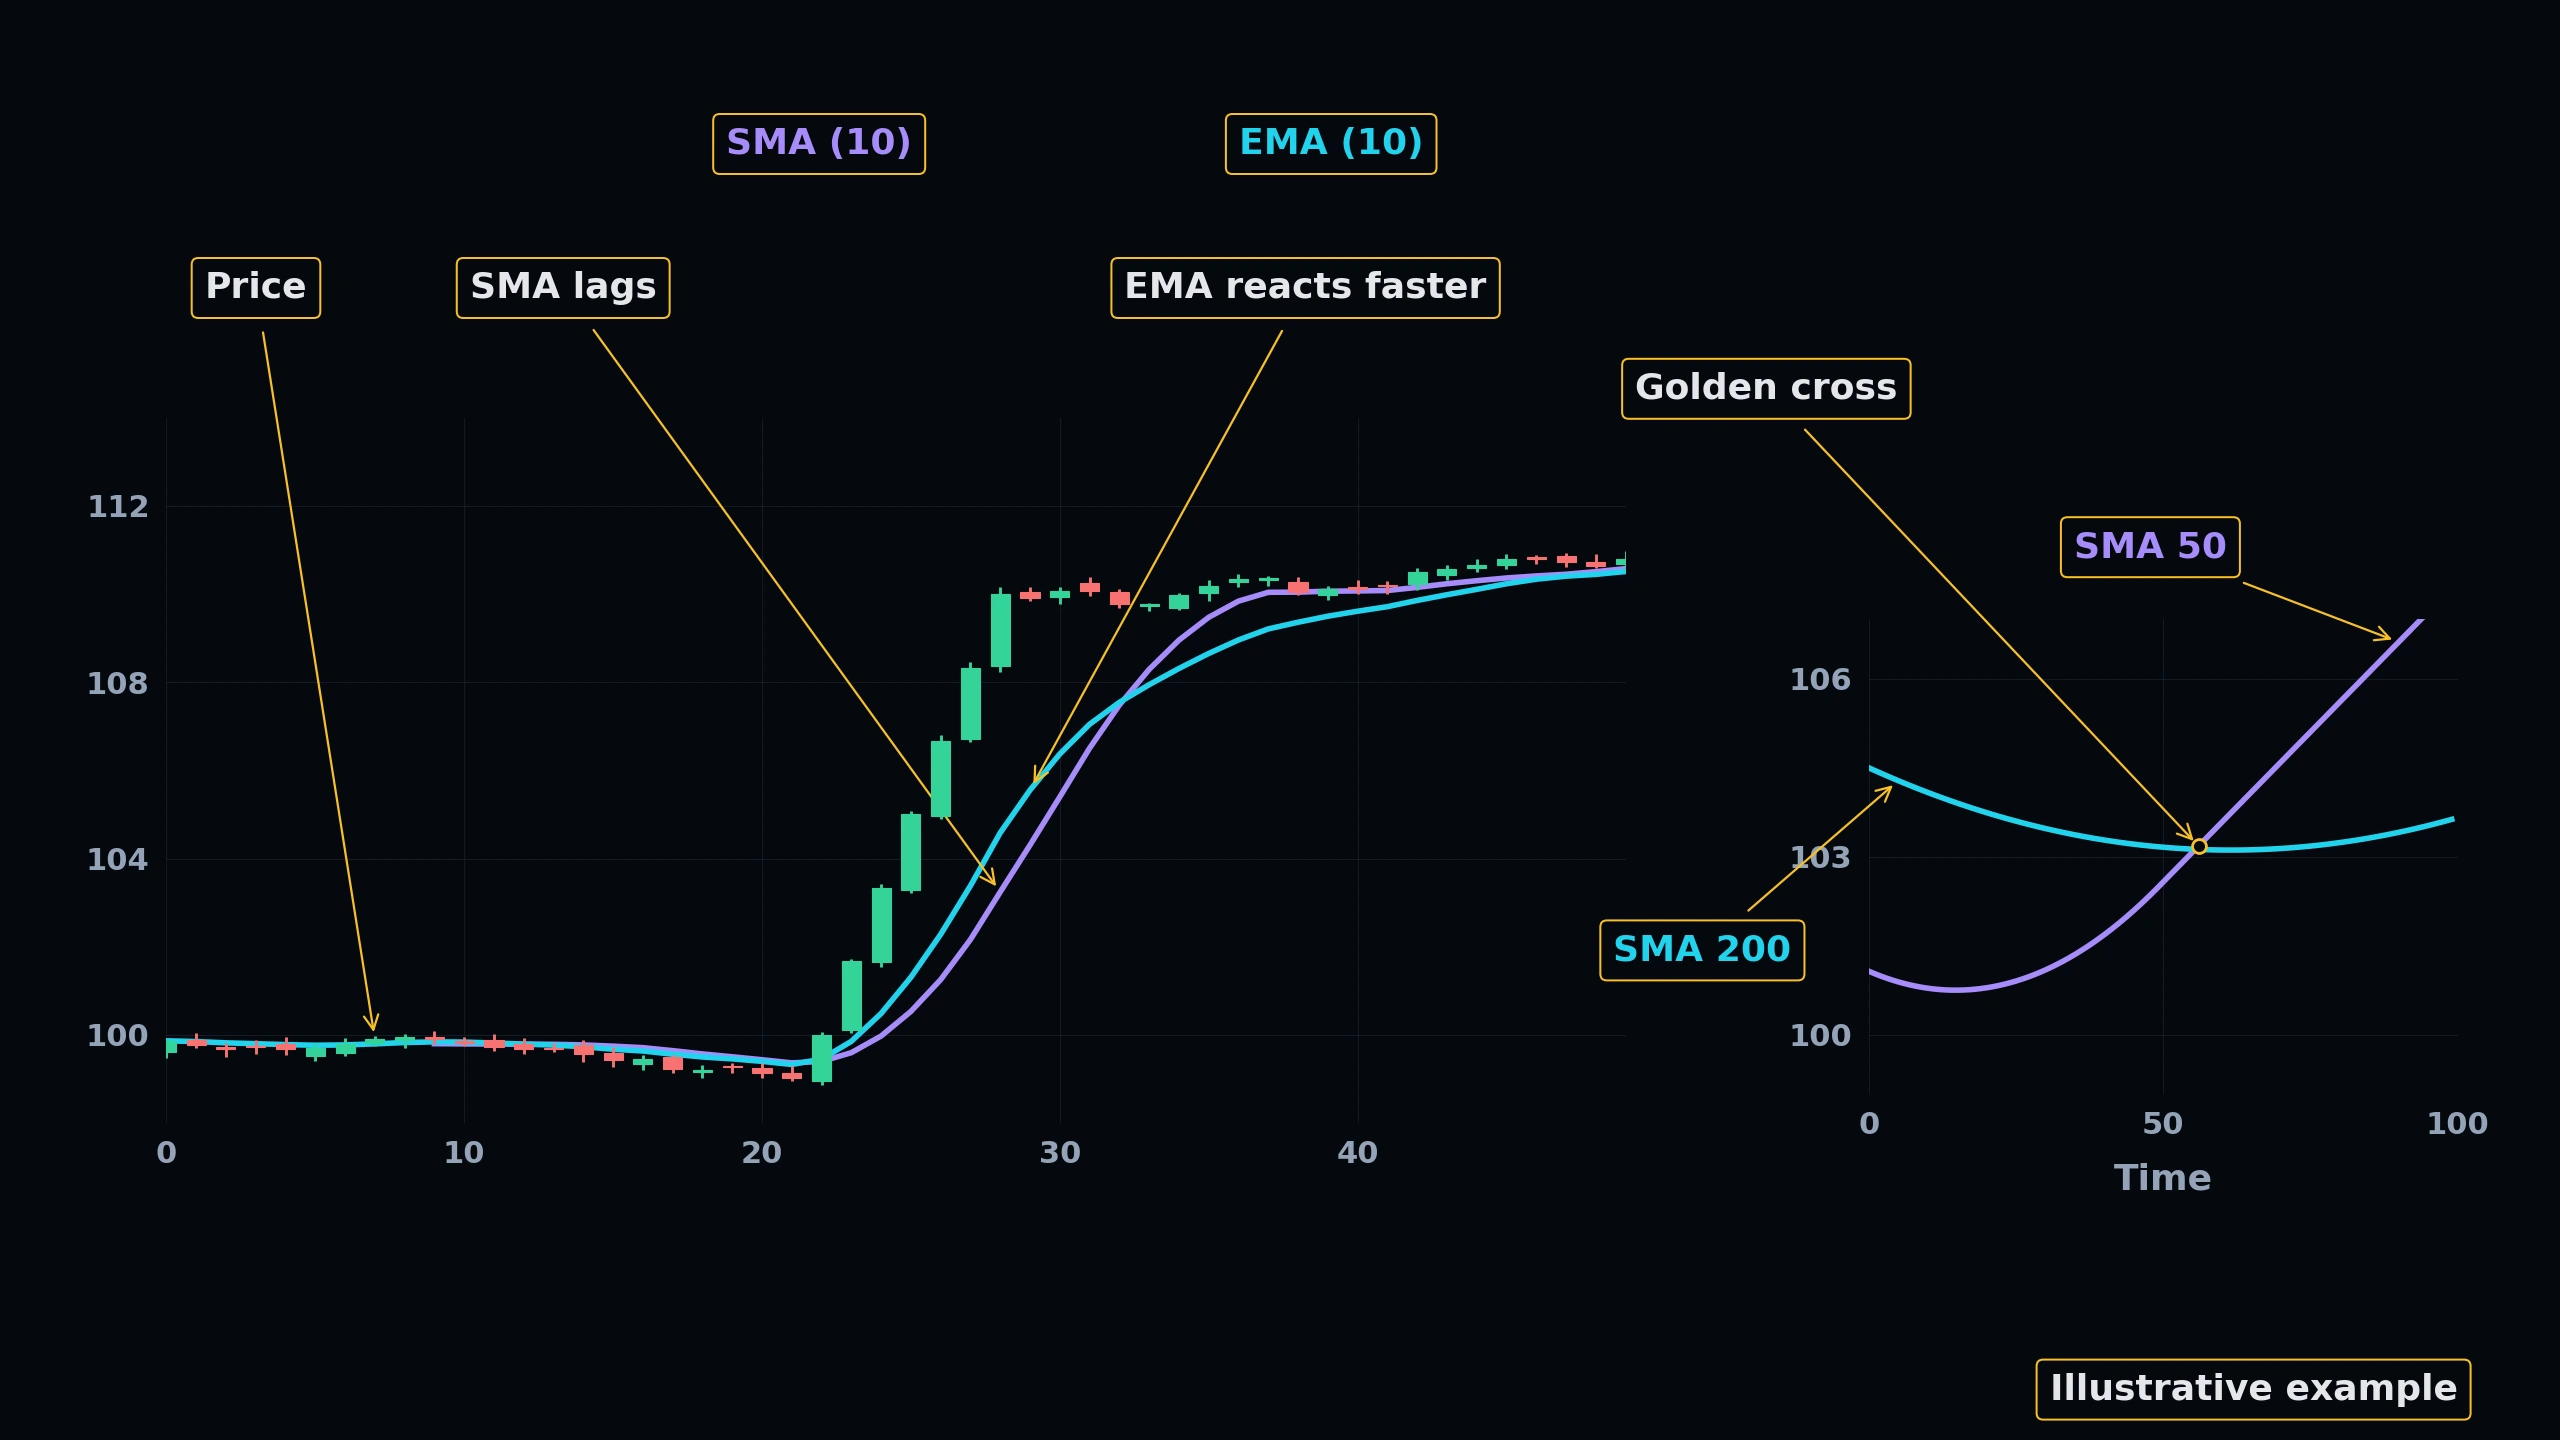
Moving Averages smooth out short-term price noise. The Simple Moving Average (SMA) calculates the average price of the last N periods. The Exponential Moving Average (EMA) assigns higher mathematical weight to the most recent price data.
This weighting makes the EMA respond much faster to price reversals, though it can also result in more false signals (whipsaws) than the slower-moving SMA.
★ Golden Cross: Occurs when a short-term MA (e.g., 50 SMA) crosses above a long-term MA (e.g., 200 SMA), signaling a structural shift to an uptrend.
 Click to enlarge
Technical Market Structure Blueprint
Interactively map key institutional Price Action patterns. Switch between the 4 technical blueprints below and click the glowing blue hotspots to dissect the market mechanics.
Pattern Technical Explainer
Select any glowing node on the technical chart to inspect the institutional structure details.
KNOWLEDGE RECONNAISSANCE
Why does the Exponential Moving Average (EMA) react faster to price changes than the Simple Moving Average (SMA)?
More lessons in this module
- 4.0: Foundations of Price Action & Candlestick Anatomy
- 4.1: Support and Resistance Zones vs. Single Lines
- 4.2: Trendlines, Channels, and Structural Breakouts
- 4.3: Volume Analysis & Volume Profile (VPVR/POC)
- 4.5: Oscillator Mechanics: RSI and Stochastic Indicators
- 4.6: Trend Strength Indicators: MACD and ADX
- 4.7: Volatility Bands: Bollinger Bands & ATR
- 4.8: Classical Chart Patterns: Double Tops, Head & Shoulders
- 4.9: Fibonacci Retracements, Extensions & Golden Ratio
- 4.10: Multi-Timeframe Analysis & Confluence Modeling
- 4.11: Backtesting Technical Indicators & False Signal Filtering
Signal Desk is where you practice this on real stocks: real option chains (about 15 minutes delayed), the Trade Check and a paper-trading account that risks no real money. Join to add it, your progress tracking and PDF downloads.