
A hands-on options curriculum covering real trading concepts. Read the lessons, work through examples, and test your knowledge.
OVERALL ACADEMY PROGRESS
Free Lesson
Every lesson is free to read. Subscribe to add Signal Desk, progress tracking, PDF downloads and the lesson tutor.
Lesson 1: 5.0: Introduction to Candlestick Analysis
Learn the history, anatomy, and construction of Japanese candlesticks and how they reveal market sentiment.
1. History and Philosophy of Candlestick Charting
Japanese candlestick charting was developed in the 18th century by Munehisa Homma, a legendary rice merchant from Sakata. Homma realized that while supply and demand influenced rice prices, the emotions of market participants played an equally critical role in pricing.
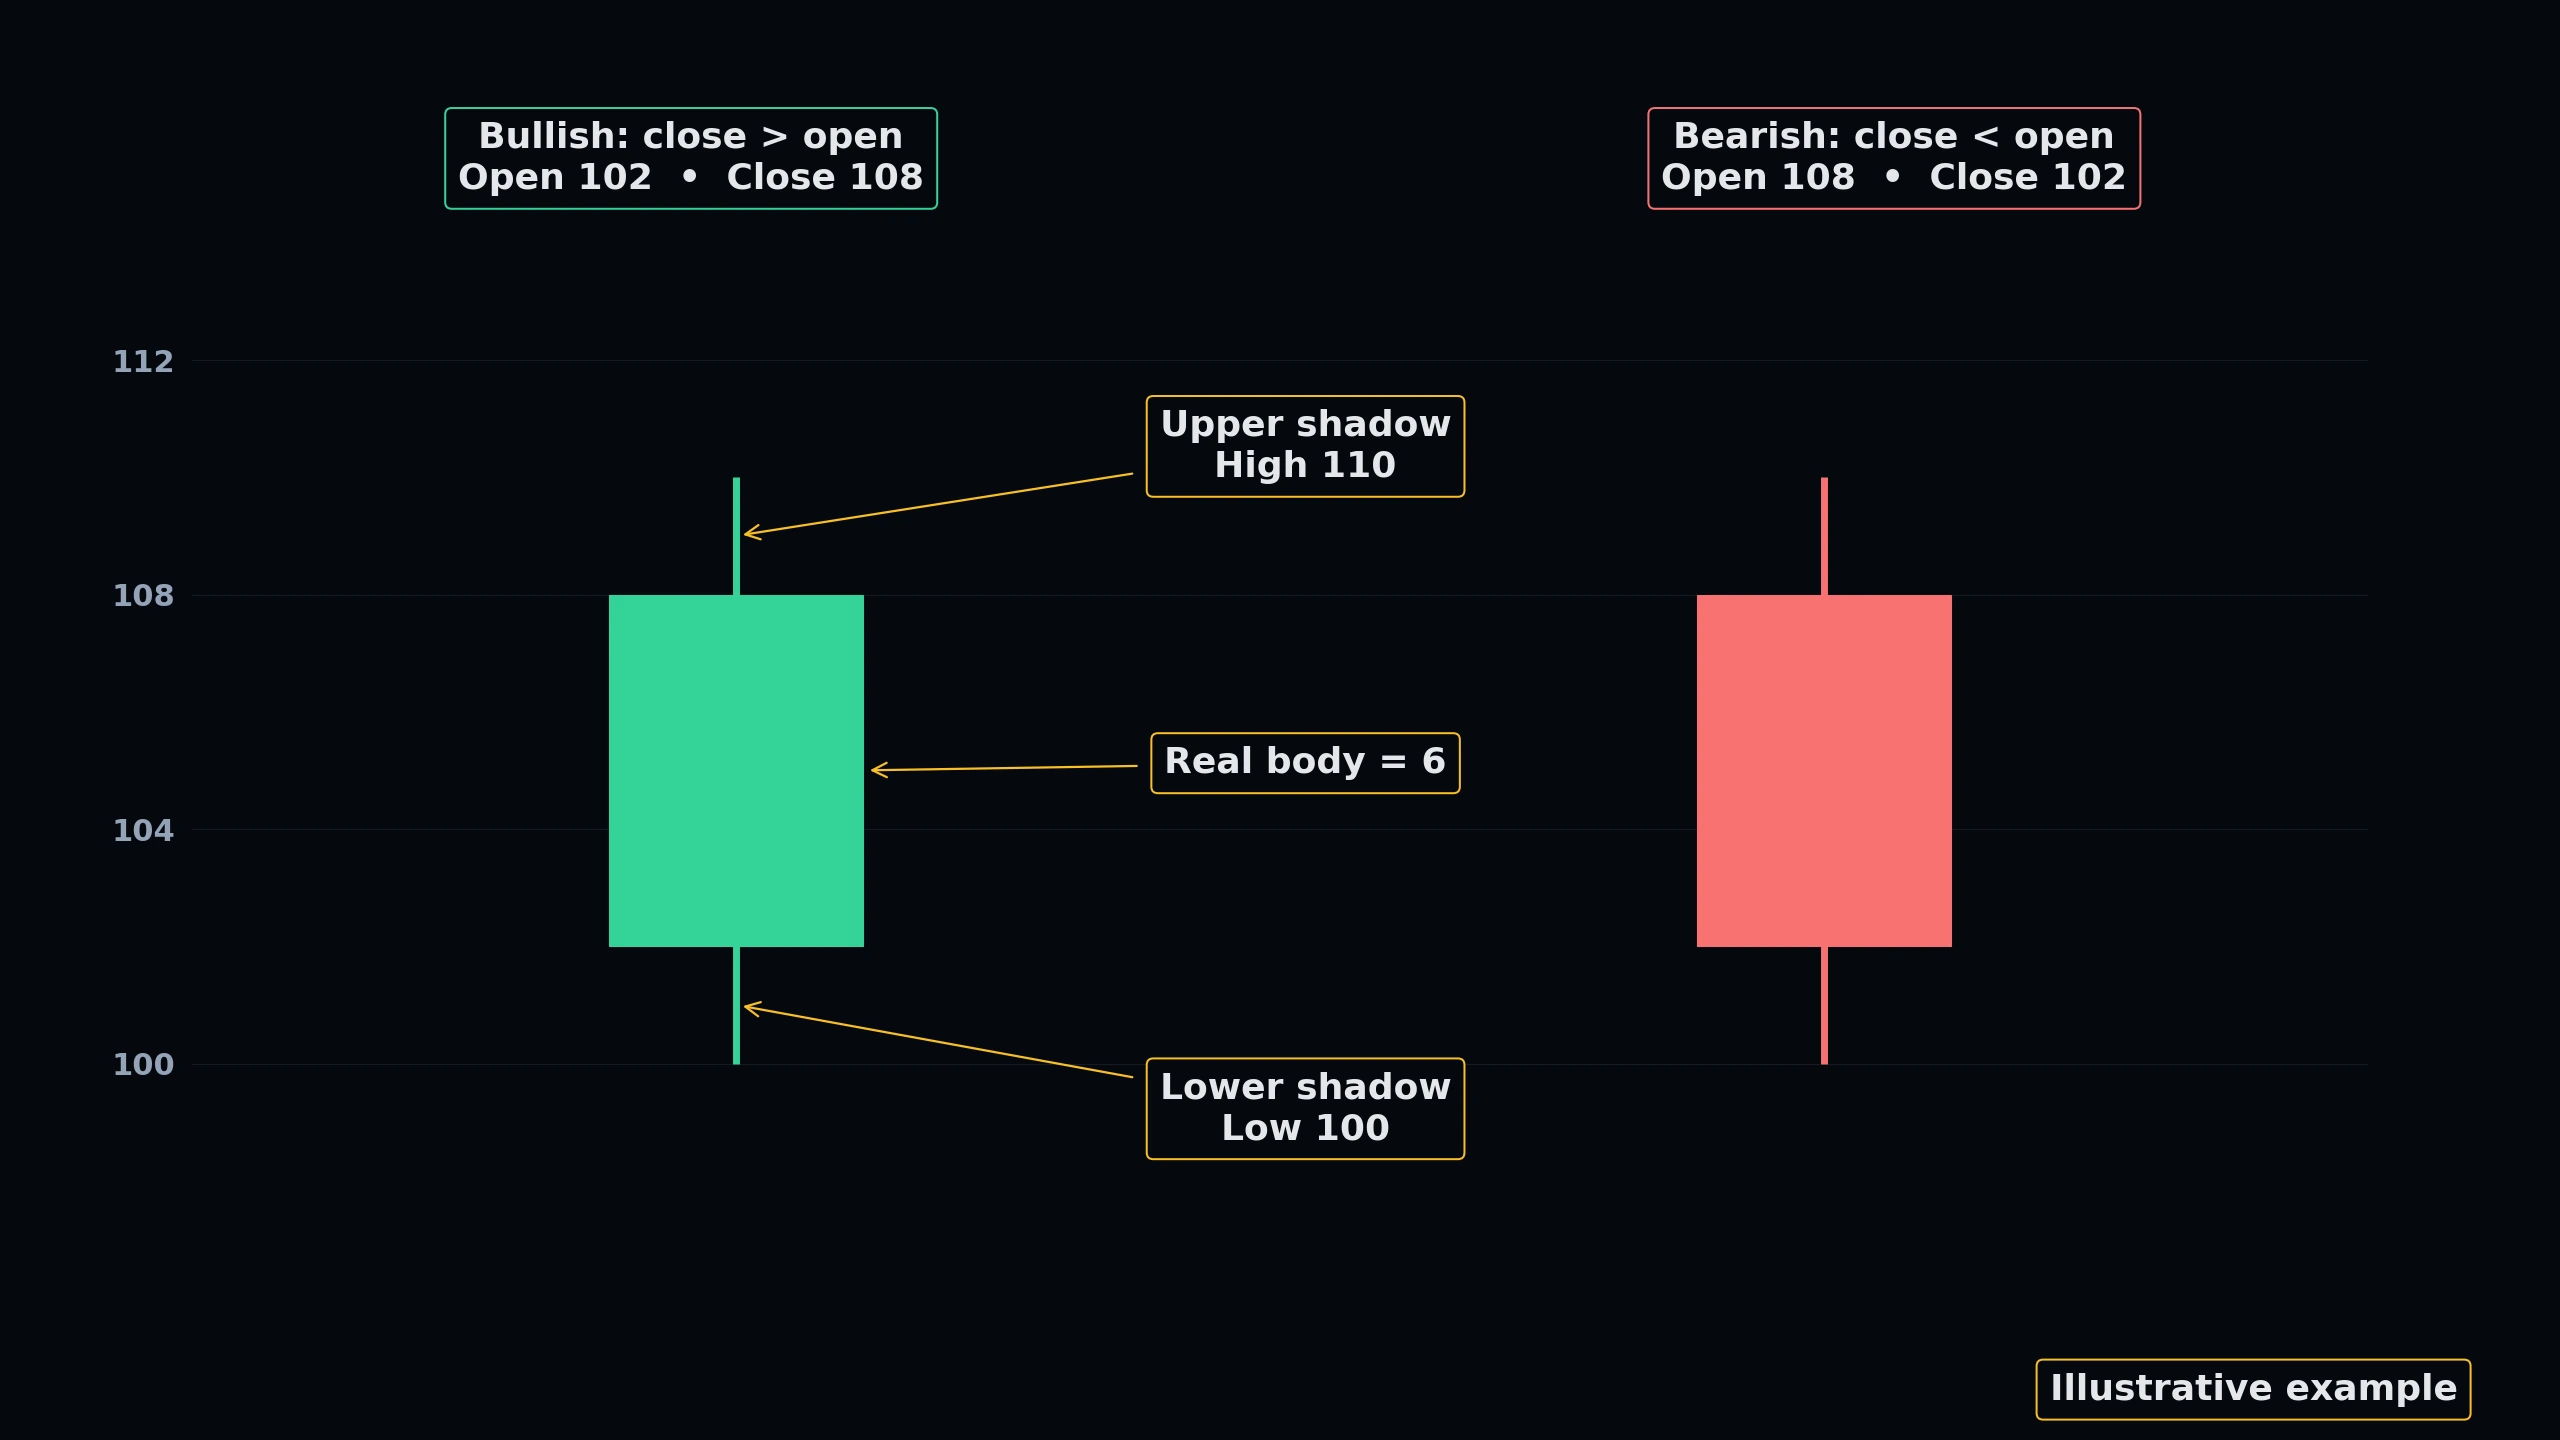
Candlestick charts display the open, high, low, and close (OHLC) of an asset for a specific time interval. The wide section is called the real body, representing the price range between the opening and closing transactions.
★ Core Concept: The color of the body indicates direction: a green body represents a bullish session (close > open), while a red body indicates a bearish session (close < open).
2. Anatomy of Shadows and Wicks
The thin lines above and below the real body are known as shadows, wicks, or tails. The upper shadow represents the highest price reached during the period, while the lower shadow marks the absolute lowest price.
Long shadows reveal price rejection. An exceptionally long upper shadow indicates that buyers pushed prices up significantly, but sellers aggressively stepped in before the close, forcing the price back down. Conversely, long lower shadows signal that sellers were rebuffed by strong buying interest.
 Click to enlarge
Technical Market Structure Blueprint
Interactively map key institutional Price Action patterns. Switch between the 4 technical blueprints below and click the glowing blue hotspots to dissect the market mechanics.
Pattern Technical Explainer
Select any glowing node on the technical chart to inspect the institutional structure details.
KNOWLEDGE RECONNAISSANCE
Who is credited with developing Japanese candlestick charting in the 18th century?
More lessons in this module
- 5.1: Single Candlestick Patterns
- 5.2: Double Candlestick Patterns
- 5.3: Triple Candlestick Patterns
- 5.4: Candlestick Continuation Patterns
- 5.5: Candlestick Reversal Patterns
- 5.6: Candlestick Psychology & Order Flow Integration
- 5.7: Common Candlestick Trading Mistakes
- 5.8: Practical Candlestick Execution Strategies
Signal Desk is where you practice this on real stocks: real option chains (about 15 minutes delayed), the Trade Check and a paper-trading account that risks no real money. Join to add it, your progress tracking and PDF downloads.