
A hands-on options curriculum covering real trading concepts. Read the lessons, work through examples, and test your knowledge.
OVERALL ACADEMY PROGRESS
Free Lesson
Every lesson is free to read. Subscribe to add Signal Desk, progress tracking, PDF downloads and the lesson tutor.
Lesson 2: 5.1: Single Candlestick Patterns
Master key individual candle formations including the Hammer, Shooting Star, Doji, and Marubozu.
1. The Doji and Marubozu
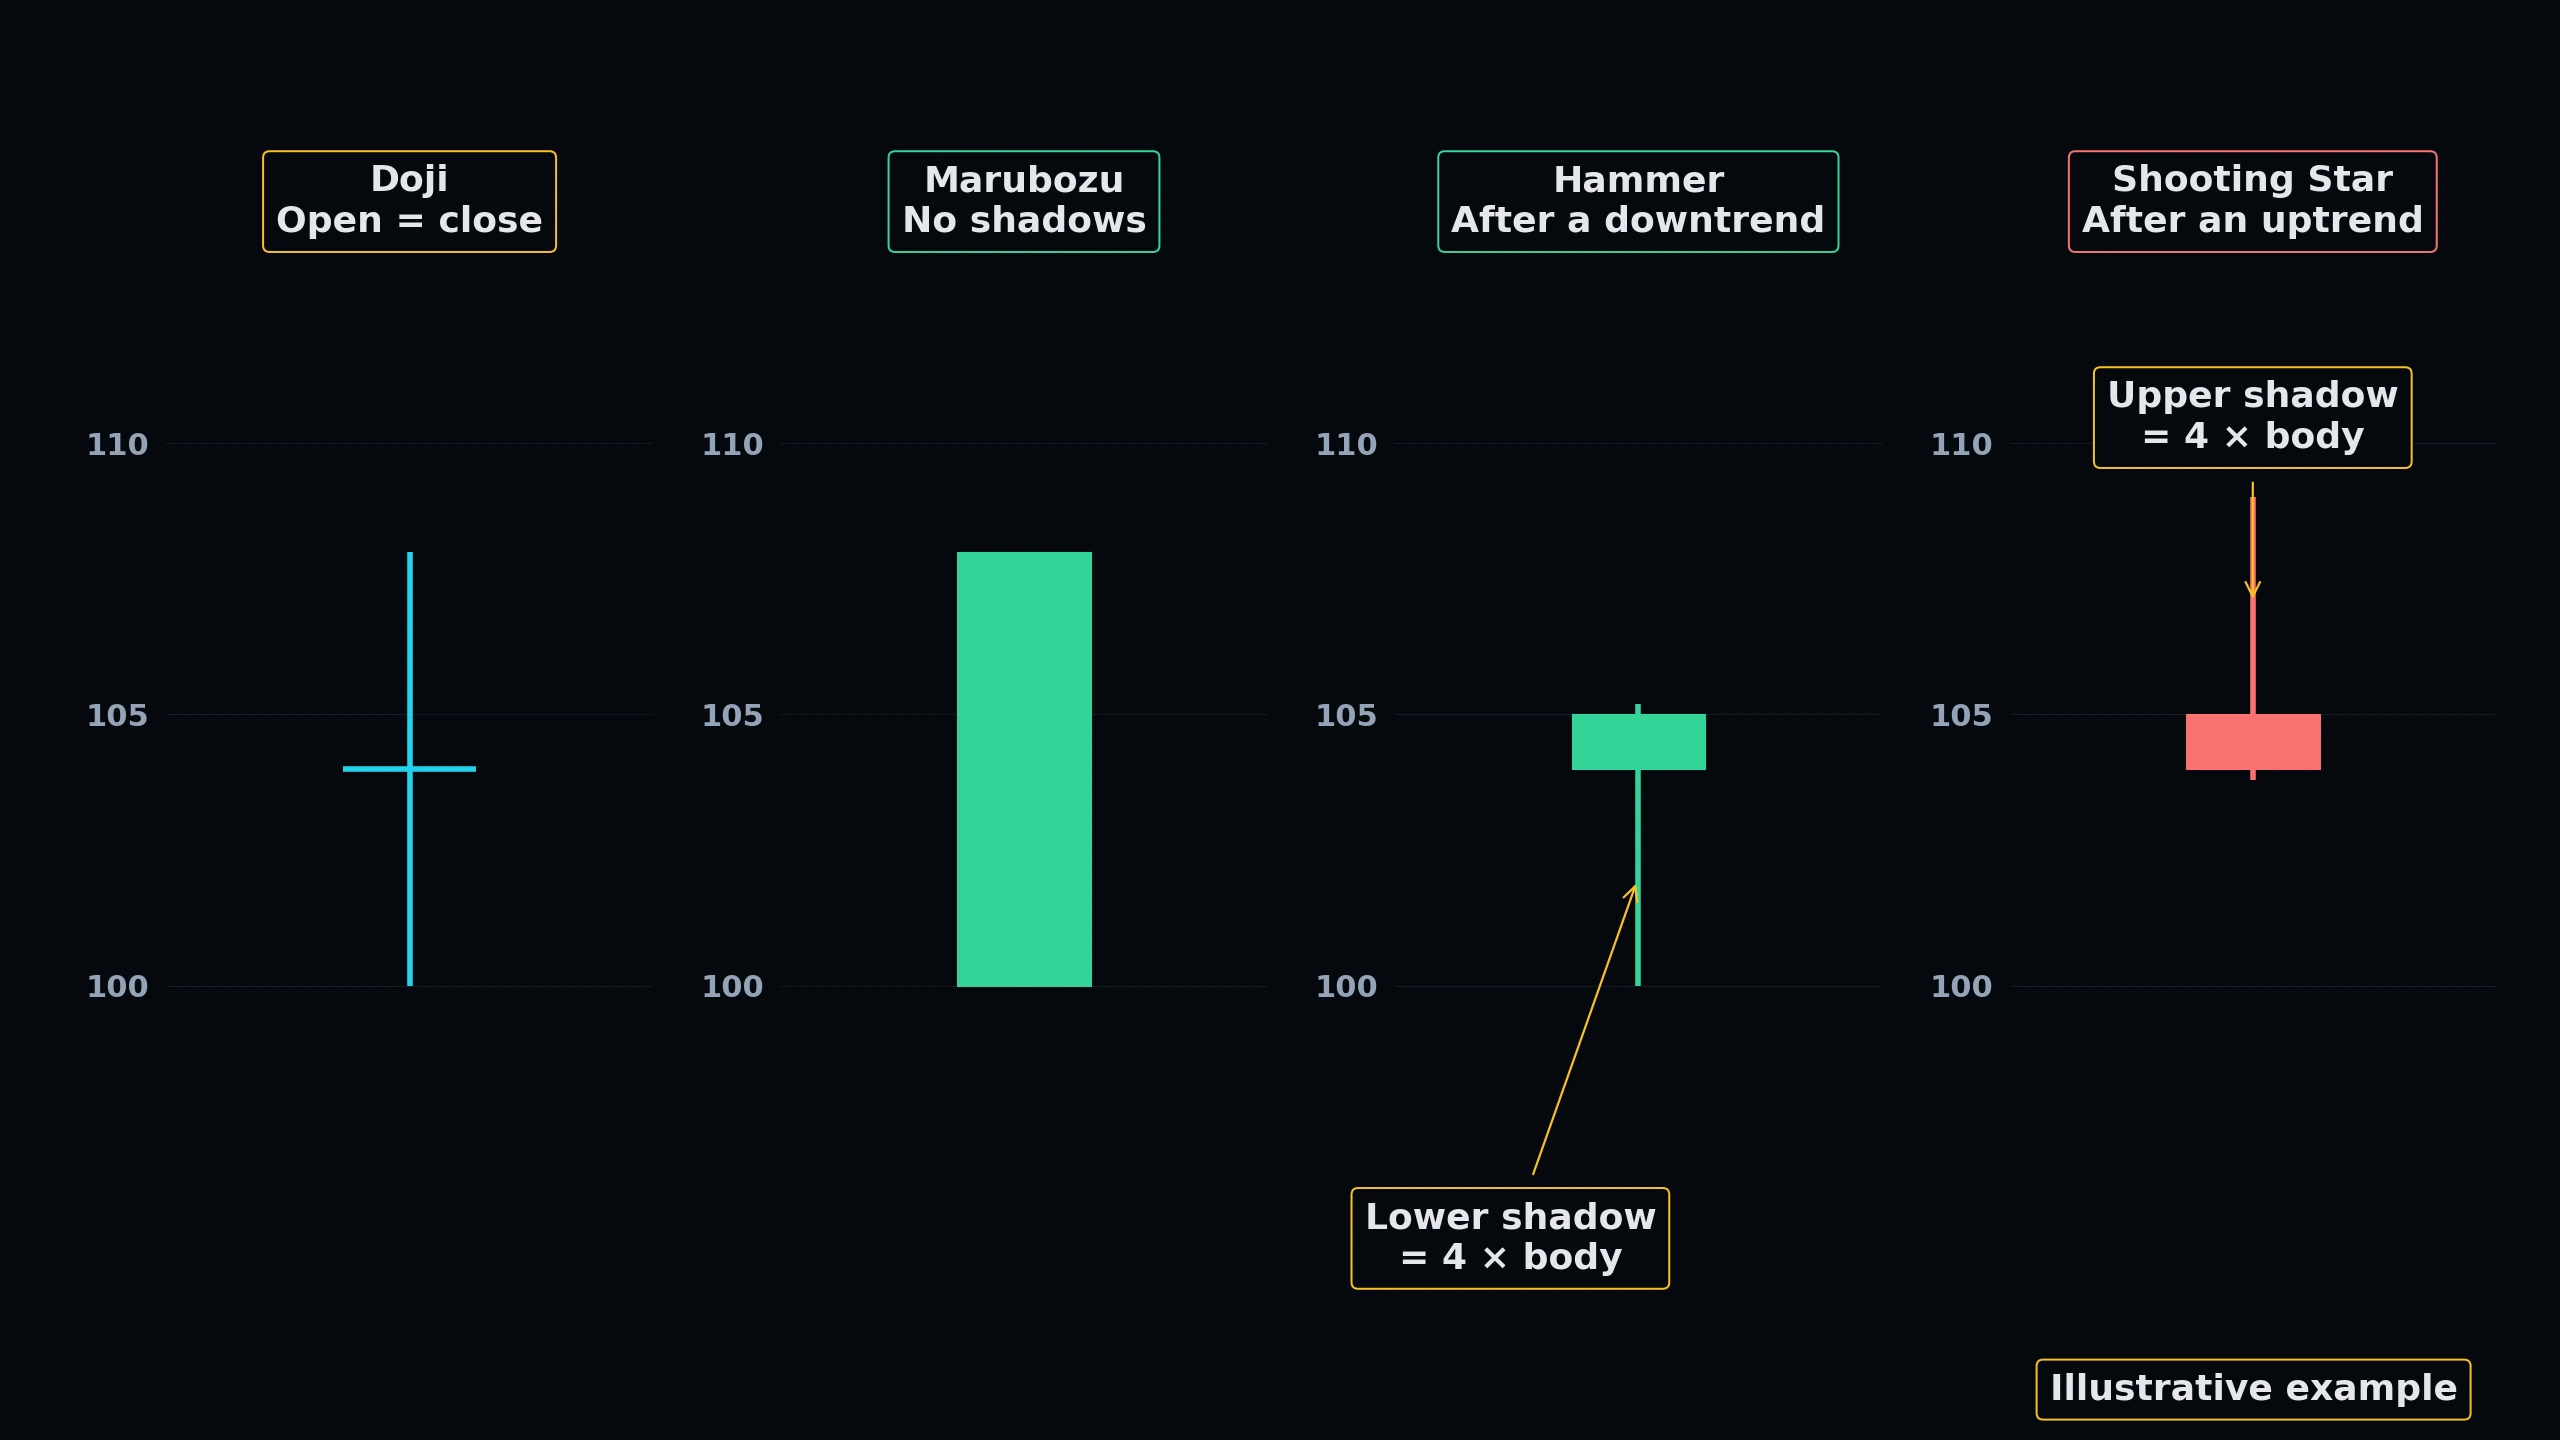
A Doji forms when the opening and closing prices are virtually identical, resulting in a tiny or non-existent real body. It reflects complete equilibrium and indecision between buyers and sellers, often warning of an impending trend pause or reversal.
A Marubozu is the opposite: a large real body with little to no shadows. A bullish green Marubozu indicates that buyers controlled the entire session from open to close, demonstrating absolute dominance.
2. Hammer and Shooting Star
A Hammer has a small real body at the top of the range and a long lower shadow (at least twice the body's length). It is a bullish reversal pattern that forms at the bottom of a downtrend, signaling heavy selling was met with institutional buying.
A Shooting Star is the bearish equivalent, forming at the peak of an uptrend with a small body at the bottom and a long upper shadow, signaling aggressive rejection of higher prices.
 Click to enlarge
Technical Market Structure Blueprint
Interactively map key institutional Price Action patterns. Switch between the 4 technical blueprints below and click the glowing blue hotspots to dissect the market mechanics.
Pattern Technical Explainer
Select any glowing node on the technical chart to inspect the institutional structure details.
KNOWLEDGE RECONNAISSANCE
Which single candlestick pattern represents a complete lack of real body, signaling market indecision?
More lessons in this module
- 5.0: Introduction to Candlestick Analysis
- 5.2: Double Candlestick Patterns
- 5.3: Triple Candlestick Patterns
- 5.4: Candlestick Continuation Patterns
- 5.5: Candlestick Reversal Patterns
- 5.6: Candlestick Psychology & Order Flow Integration
- 5.7: Common Candlestick Trading Mistakes
- 5.8: Practical Candlestick Execution Strategies
Signal Desk is where you practice this on real stocks: real option chains (about 15 minutes delayed), the Trade Check and a paper-trading account that risks no real money. Join to add it, your progress tracking and PDF downloads.