
A hands-on options curriculum covering real trading concepts. Read the lessons, work through examples, and test your knowledge.
OVERALL ACADEMY PROGRESS
Free Lesson
Every lesson is free to read. Subscribe to add Signal Desk, progress tracking, PDF downloads and the lesson tutor.
Lesson 8: 5.7: Common Candlestick Trading Mistakes
Learn to identify and avoid the major pitfalls of trading candlesticks, such as pattern isolation.
1. The Pitfall of Isolation
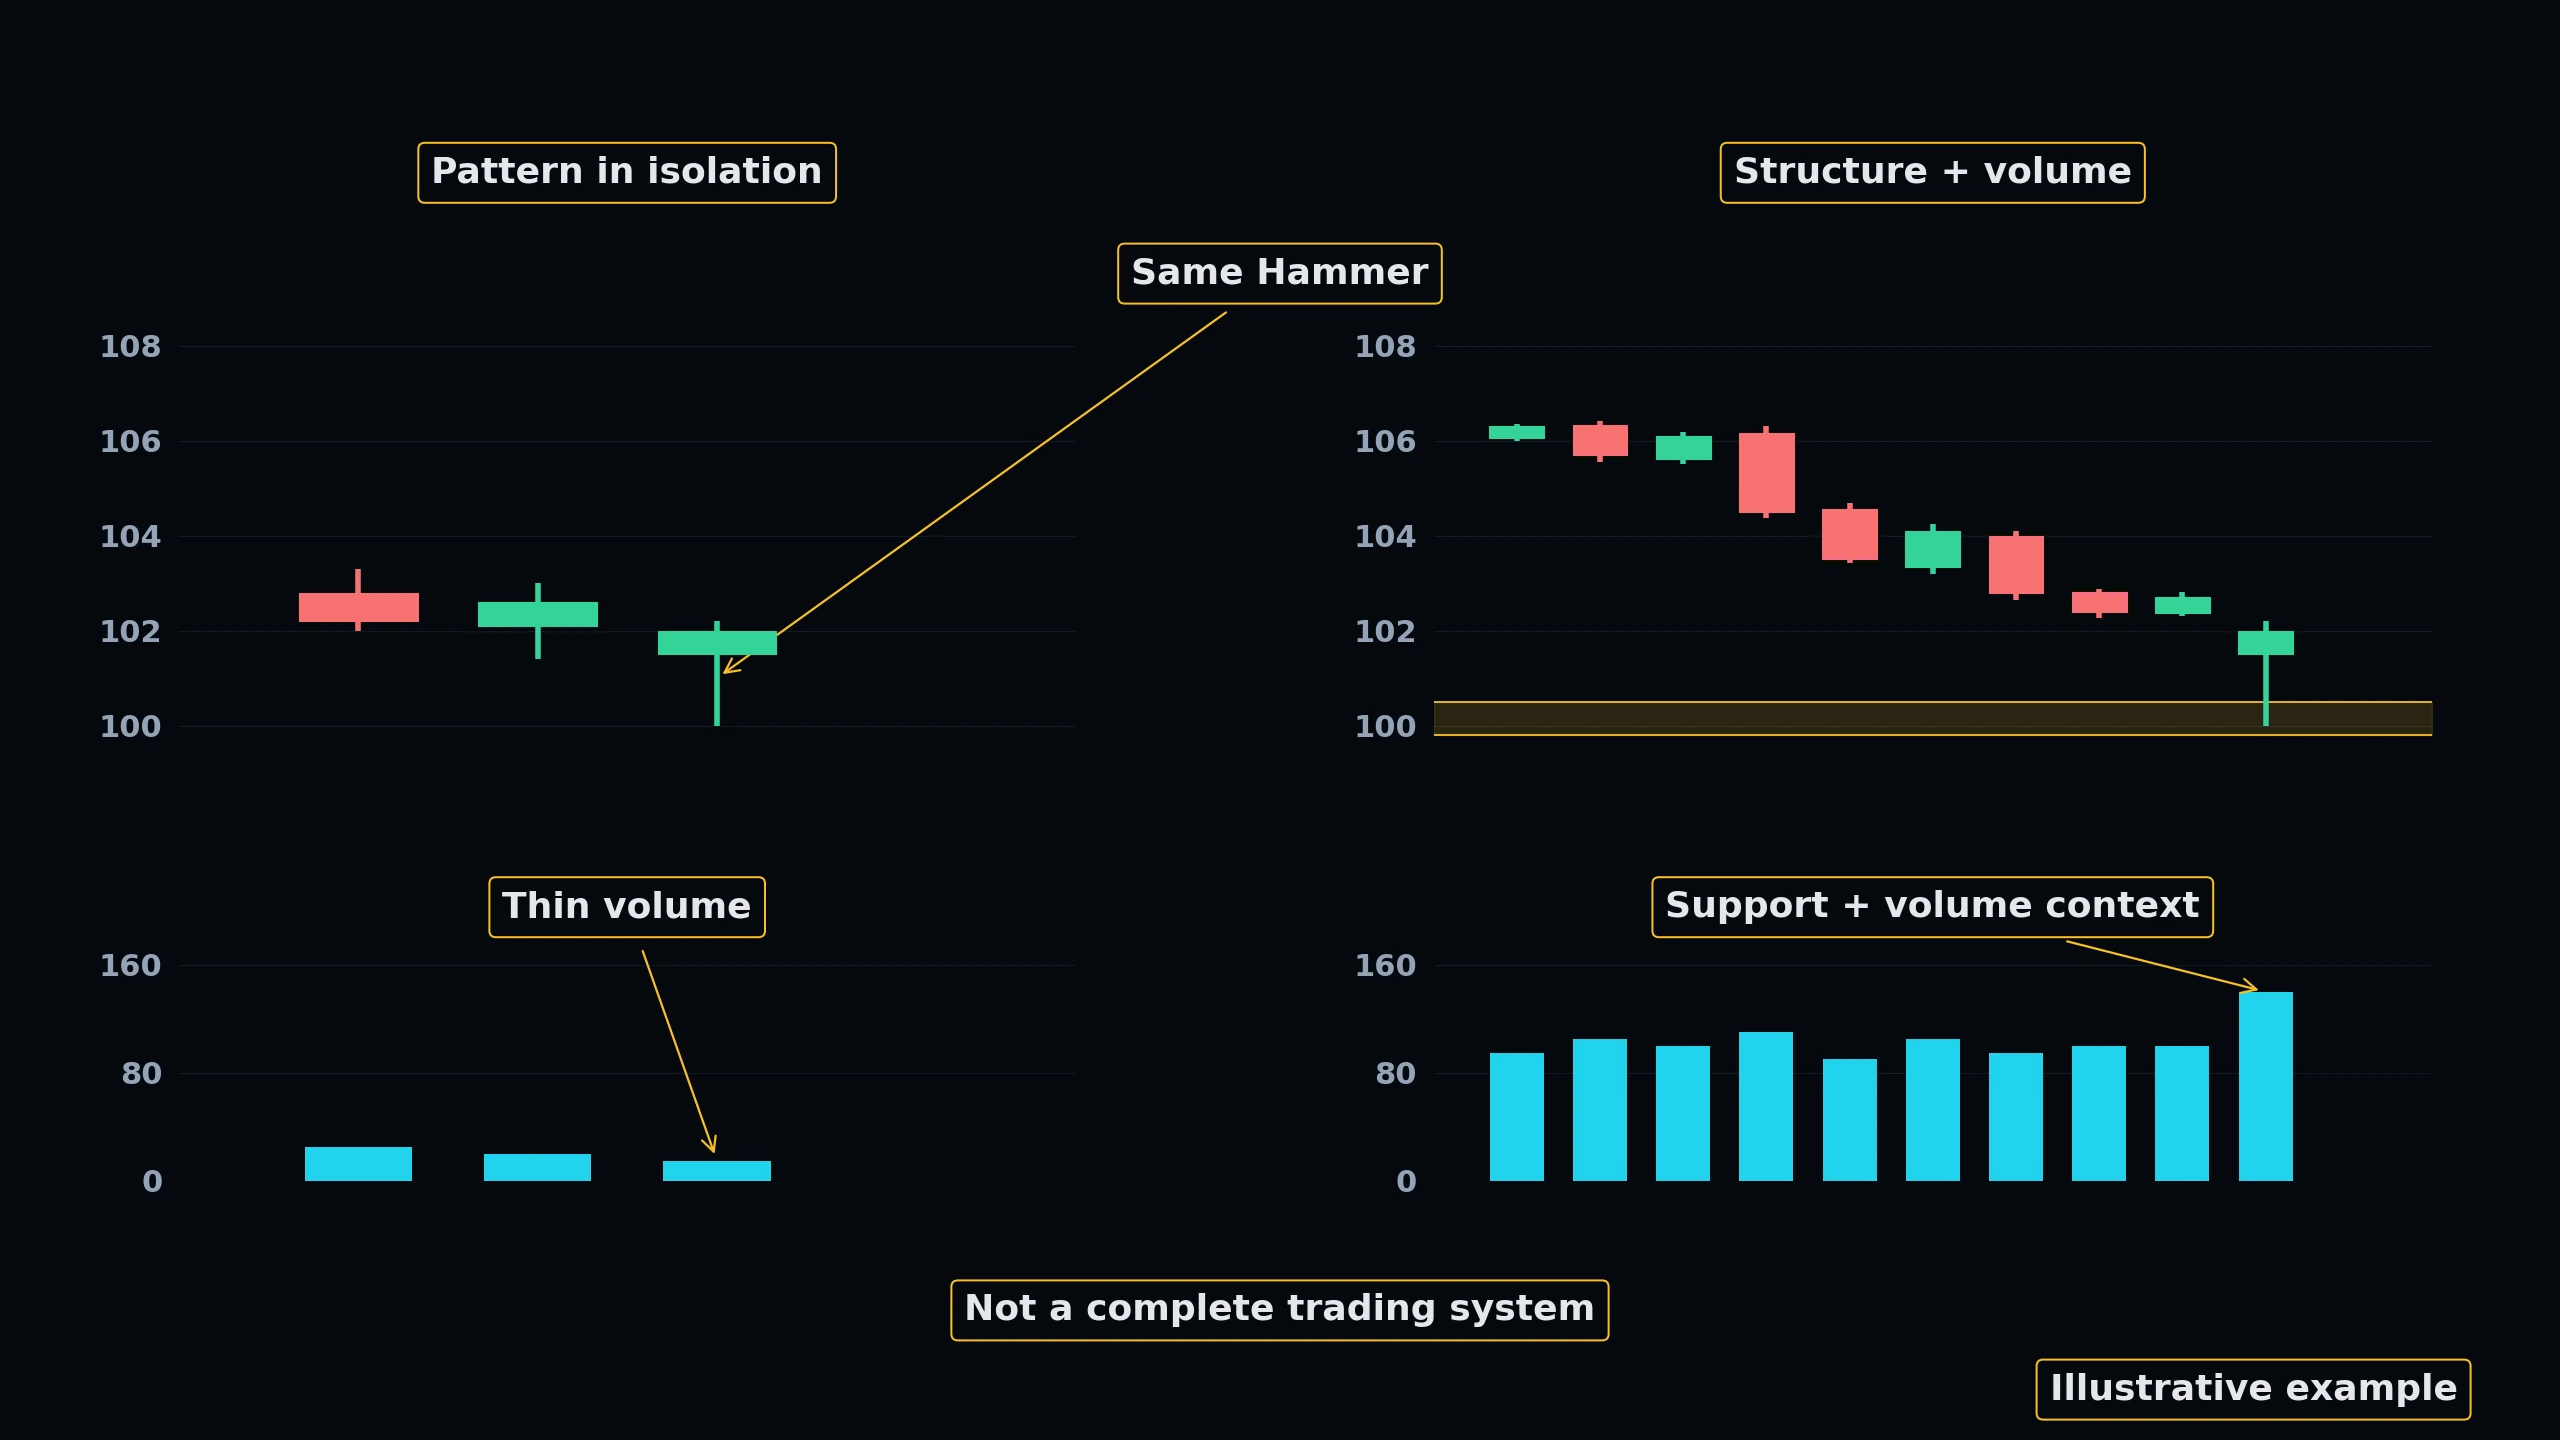
The single greatest mistake retail traders make is trading candlesticks in absolute isolation. Seeing a Hammer and immediately buying without considering whether it is at a key support or resistance level is a recipe for rapid capital drawdown.
Another major mistake is ignoring volume. A reversal pattern on extremely thin, low volume is easily manipulated and lacks institutional sponsorship, making it highly prone to failure.
★ Core Rule: Candlesticks are triggers, not a complete trading system. Use them to enter trades, but let market structure determine the trade thesis.
 Click to enlarge
Technical Market Structure Blueprint
Interactively map key institutional Price Action patterns. Switch between the 4 technical blueprints below and click the glowing blue hotspots to dissect the market mechanics.
Pattern Technical Explainer
Select any glowing node on the technical chart to inspect the institutional structure details.
KNOWLEDGE RECONNAISSANCE
What is the primary danger of trading candlestick patterns in isolation?
More lessons in this module
- 5.0: Introduction to Candlestick Analysis
- 5.1: Single Candlestick Patterns
- 5.2: Double Candlestick Patterns
- 5.3: Triple Candlestick Patterns
- 5.4: Candlestick Continuation Patterns
- 5.5: Candlestick Reversal Patterns
- 5.6: Candlestick Psychology & Order Flow Integration
- 5.8: Practical Candlestick Execution Strategies
Signal Desk is where you practice this on real stocks: real option chains (about 15 minutes delayed), the Trade Check and a paper-trading account that risks no real money. Join to add it, your progress tracking and PDF downloads.