
A hands-on options curriculum covering real trading concepts. Read the lessons, work through examples, and test your knowledge.
OVERALL ACADEMY PROGRESS
Free Lesson
Every lesson is free to read. Subscribe to add Signal Desk, progress tracking, PDF downloads and the lesson tutor.
Lesson 3: 5.2: Double Candlestick Patterns
Analyze powerful multi-candle relationships including Engulfing, Harami, and Tweezer patterns.
1. Bullish and Bearish Engulfing Patterns
An Engulfing pattern consists of two candles where the second candle's body completely swallows the first candle's body. A Bullish Engulfing features a small red candle followed by a large green candle, indicating a dramatic shift in momentum from sellers to buyers.
A Bearish Engulfing features a small green candle completely engulfed by a larger red candle, signaling that sellers have aggressively seized market control.
★ Practical Note: Engulfing patterns are far more reliable when accompanied by an expansion in trading volume on the second candle.
2. Harami and Tweezers
The Harami ('pregnant' in Japanese) is the reverse of an engulfing pattern: a small candle is completely contained within the prior large candle. It suggests momentum is draining, often preceding a consolidation or reversal.
Tweezer Tops and Bottoms are two candles with matching highs or lows, showing that a specific price boundary was hit twice and strongly rejected, serving as a clean support or resistance floor.
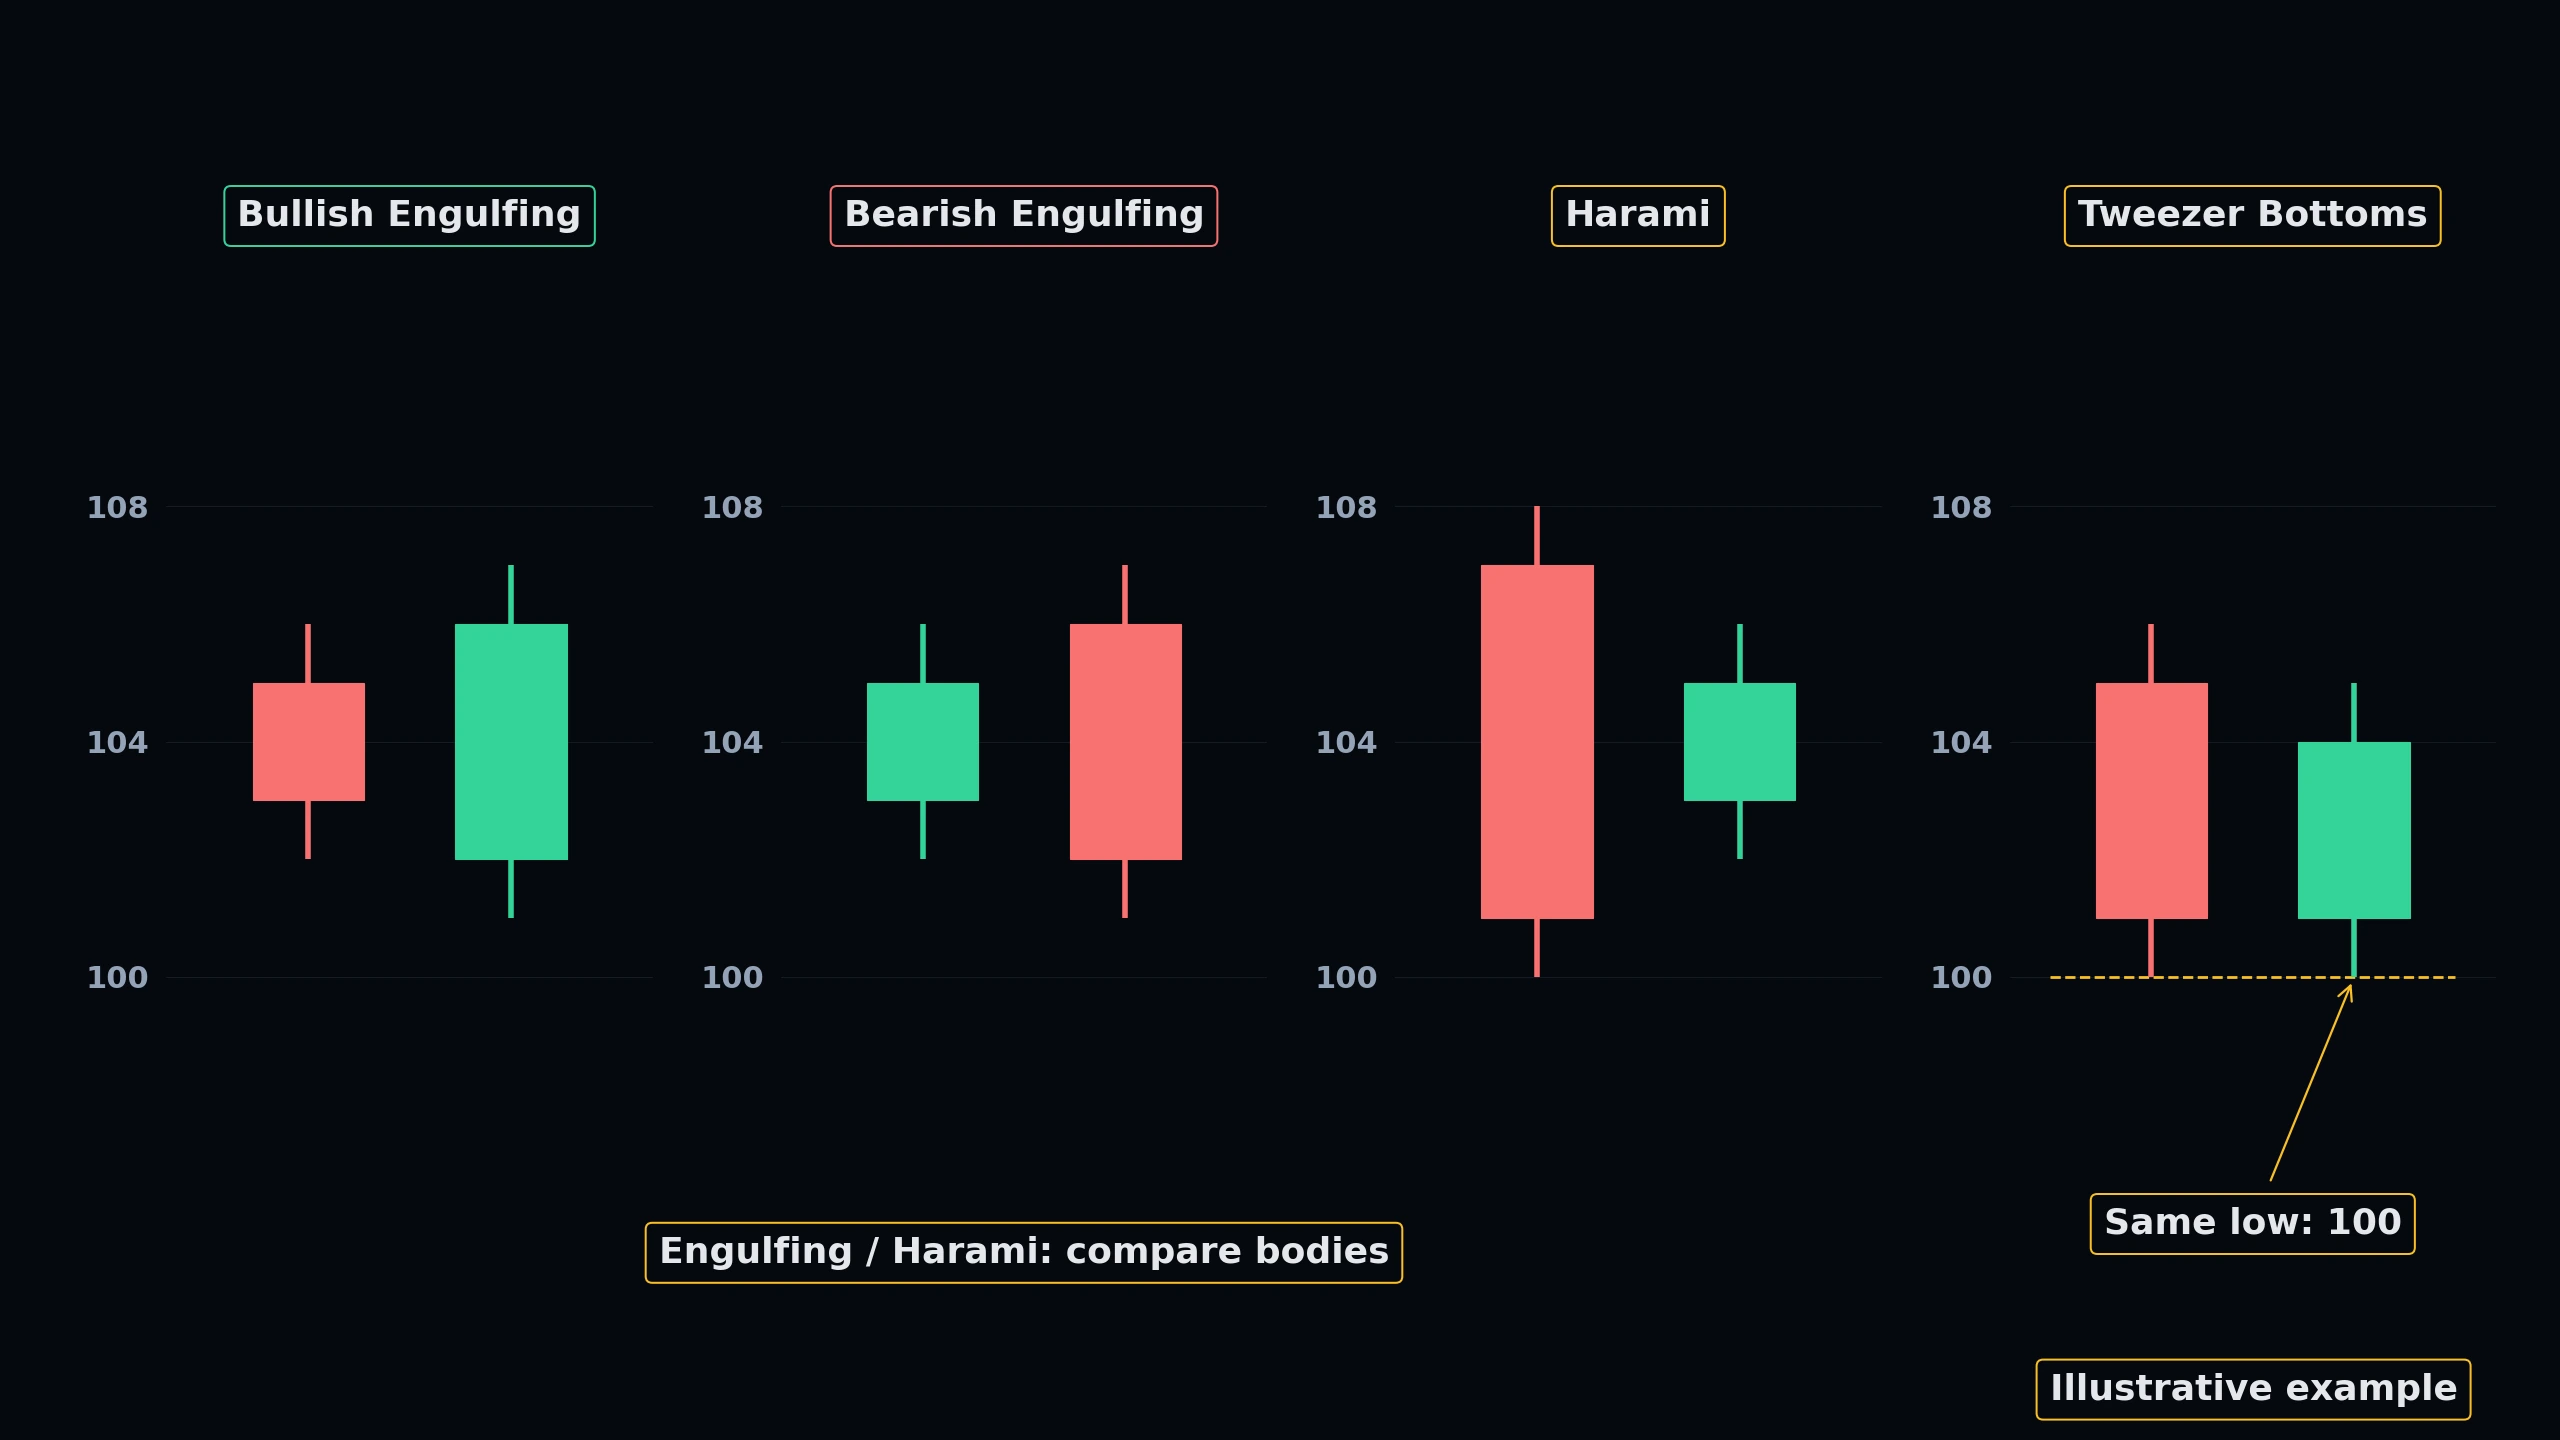 Click to enlarge
Technical Market Structure Blueprint
Interactively map key institutional Price Action patterns. Switch between the 4 technical blueprints below and click the glowing blue hotspots to dissect the market mechanics.
Pattern Technical Explainer
Select any glowing node on the technical chart to inspect the institutional structure details.
KNOWLEDGE RECONNAISSANCE
What characterizes a Bearish Engulfing pattern?
More lessons in this module
- 5.0: Introduction to Candlestick Analysis
- 5.1: Single Candlestick Patterns
- 5.3: Triple Candlestick Patterns
- 5.4: Candlestick Continuation Patterns
- 5.5: Candlestick Reversal Patterns
- 5.6: Candlestick Psychology & Order Flow Integration
- 5.7: Common Candlestick Trading Mistakes
- 5.8: Practical Candlestick Execution Strategies
Signal Desk is where you practice this on real stocks: real option chains (about 15 minutes delayed), the Trade Check and a paper-trading account that risks no real money. Join to add it, your progress tracking and PDF downloads.