
A hands-on options curriculum covering real trading concepts. Read the lessons, work through examples, and test your knowledge.
OVERALL ACADEMY PROGRESS
Free Lesson
Every lesson is free to read. Subscribe to add Signal Desk, progress tracking, PDF downloads and the lesson tutor.
Key terms in this lesson
Lesson 9: 5.8: Practical Candlestick Execution Strategies
Develop a rule-based execution plan combining candlestick patterns with key support, volume, and risk parameters.
1. The S-T-R Execution Framework
To trade candlesticks professionally, implement the S-T-R (Structure, Trigger, Risk) framework:
1. Structure: Identify the major support, resistance, order block, or moving average zone on your chart.
2. Trigger: Wait for a valid candlestick pattern (such as a Bullish Engulfing or Hammer) to form exactly inside that structure.
3. Risk: Place your stop loss just below the lowest wick of the trigger candle, and set a target at the next structural level, ensuring a minimum 1:2 Risk-to-Reward ratio.
2. Live Trade Example
★ Trade Blueprint: An asset pullbacks to a daily support zone. A long lower shadow Hammer forms on 2x average volume. Buy on the close of the Hammer candle, place stop loss 5 cents below the Hammer low, and set take profit at the previous swing high.
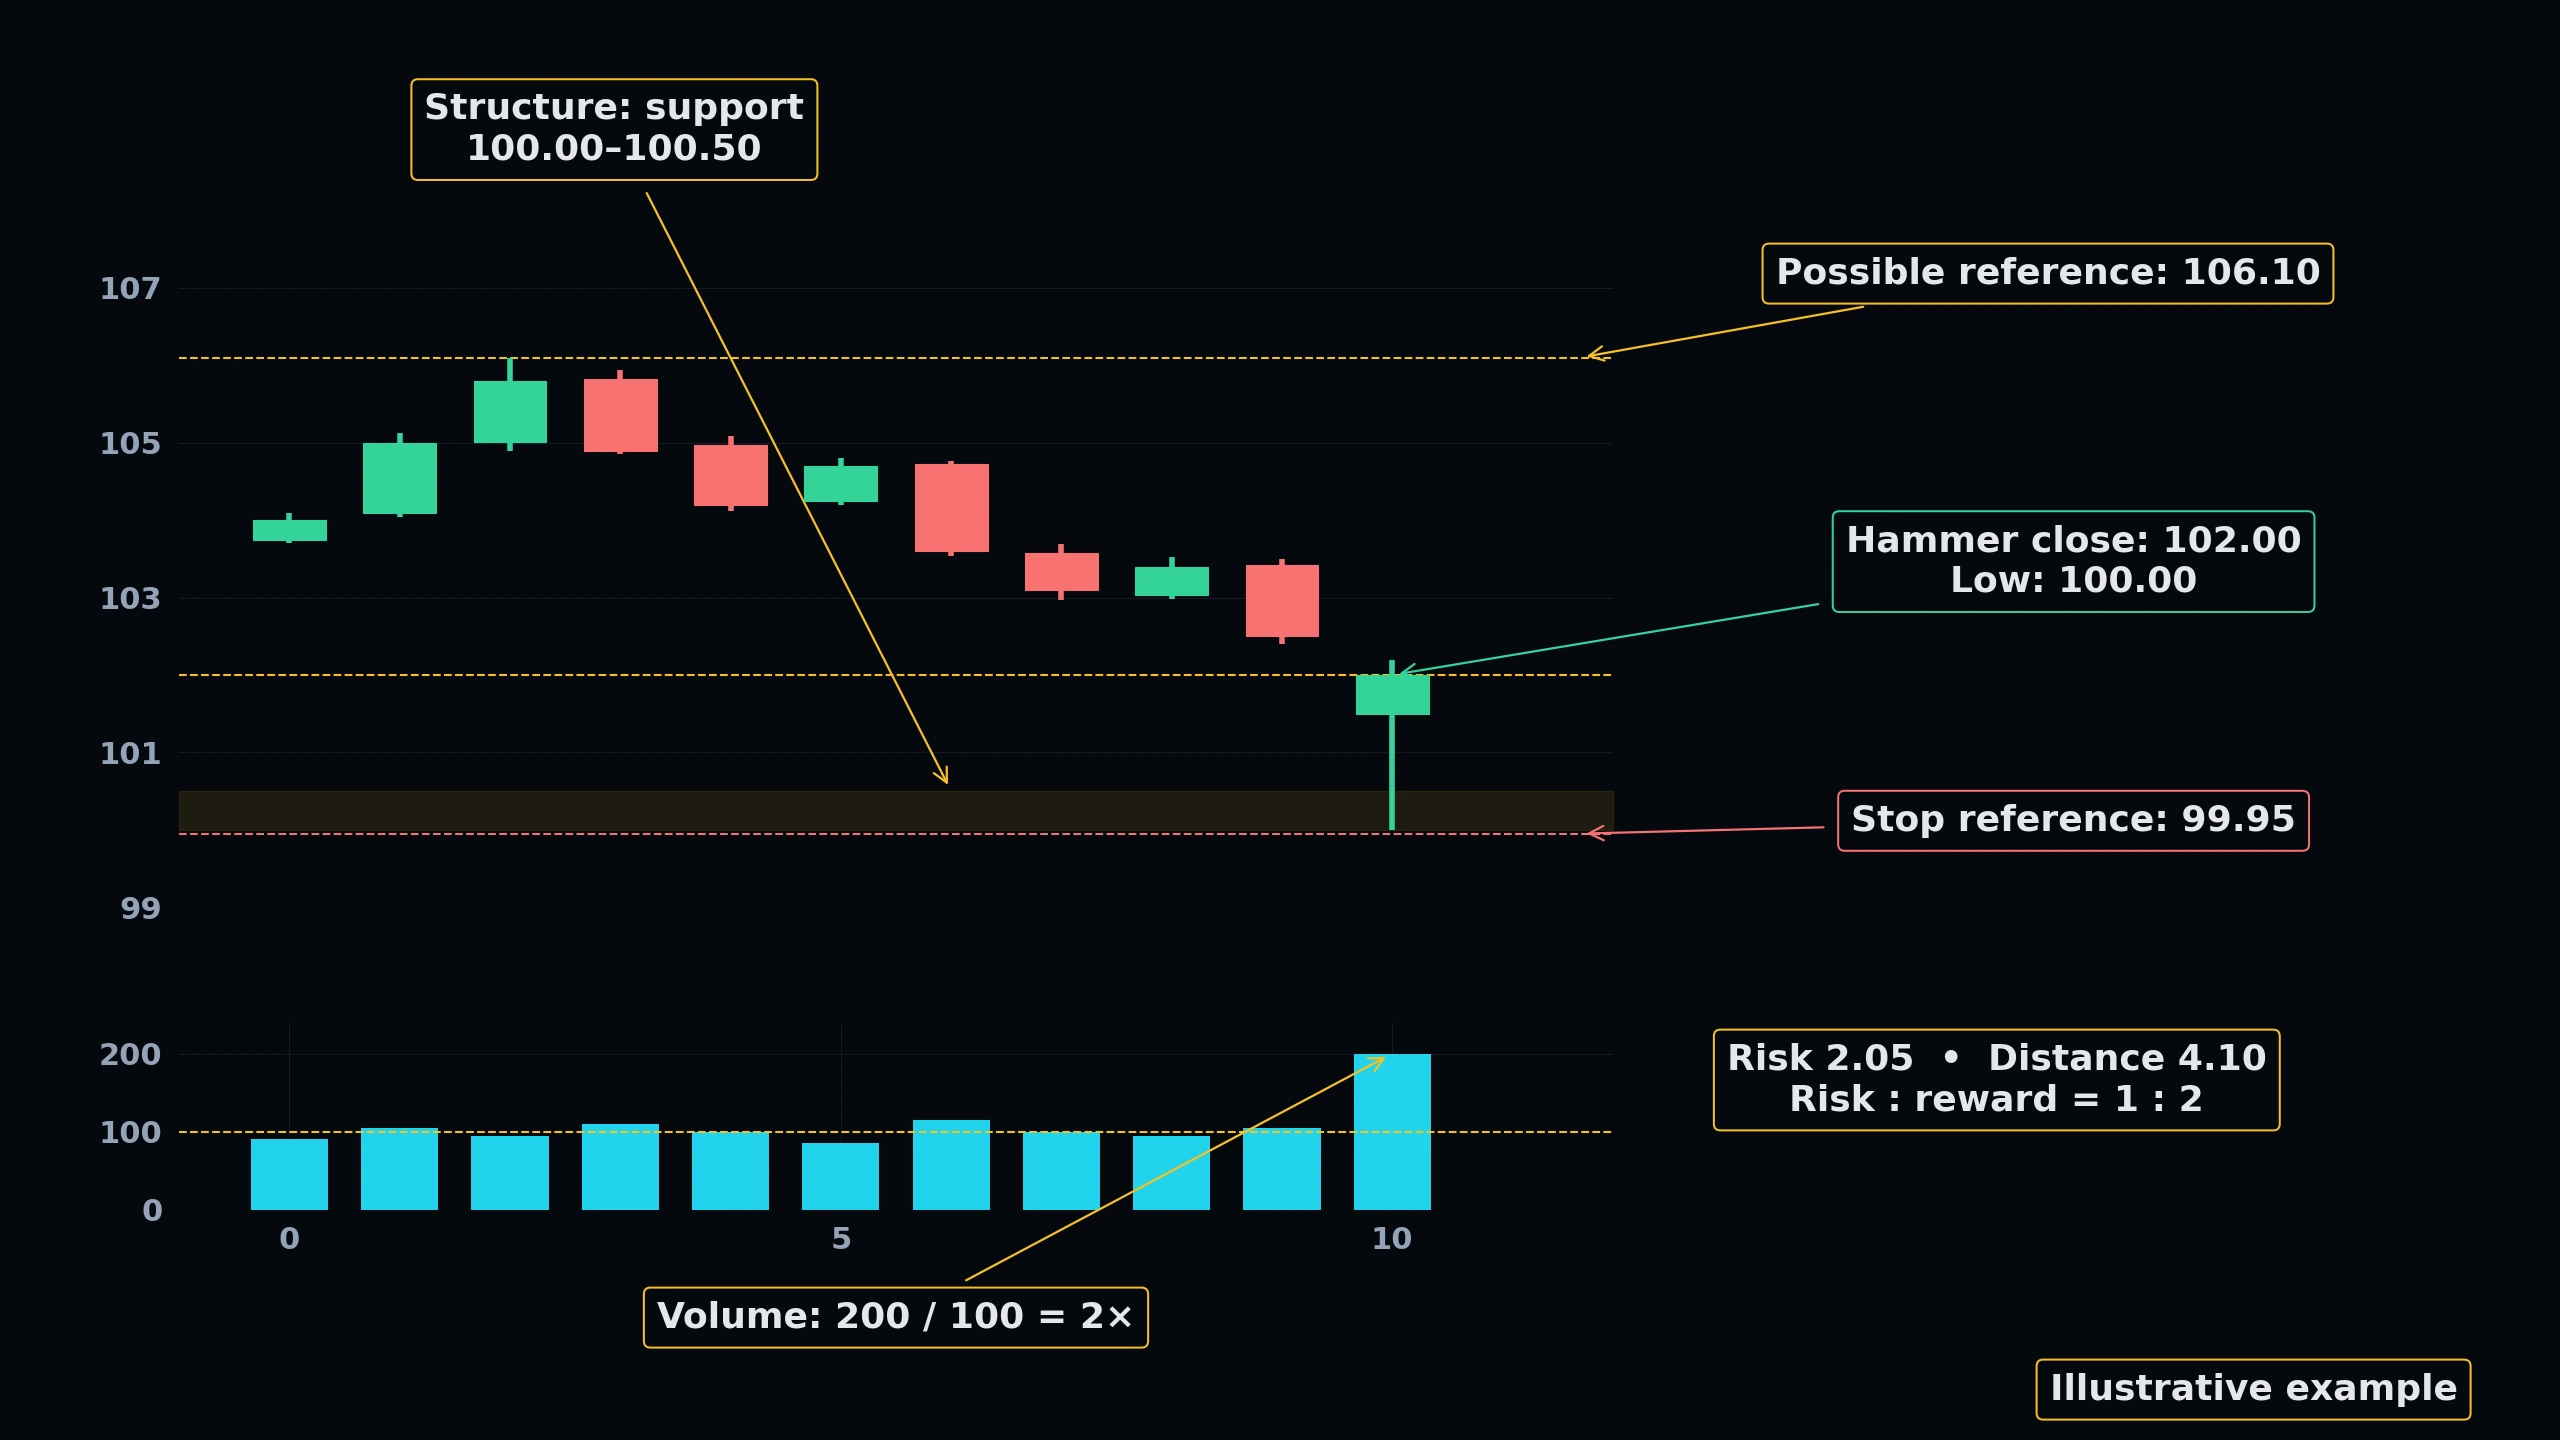 Click to enlarge
Technical Market Structure Blueprint
Interactively map key institutional Price Action patterns. Switch between the 4 technical blueprints below and click the glowing blue hotspots to dissect the market mechanics.
Pattern Technical Explainer
Select any glowing node on the technical chart to inspect the institutional structure details.
KNOWLEDGE RECONNAISSANCE
In the S-T-R execution framework, what does the 'Trigger' represent?
More lessons in this module
- 5.0: Introduction to Candlestick Analysis
- 5.1: Single Candlestick Patterns
- 5.2: Double Candlestick Patterns
- 5.3: Triple Candlestick Patterns
- 5.4: Candlestick Continuation Patterns
- 5.5: Candlestick Reversal Patterns
- 5.6: Candlestick Psychology & Order Flow Integration
- 5.7: Common Candlestick Trading Mistakes
Signal Desk is where you practice this on real stocks: real option chains (about 15 minutes delayed), the Trade Check and a paper-trading account that risks no real money. Join to add it, your progress tracking and PDF downloads.