
A hands-on options curriculum covering real trading concepts. Read the lessons, work through examples, and test your knowledge.
OVERALL ACADEMY PROGRESS
Free Lesson
Every lesson is free to read. Subscribe to add Signal Desk, progress tracking, PDF downloads and the lesson tutor.
Key terms in this lesson
 Click to enlarge
Lesson 7: 1.6: Choosing the Stock — Fundamentals and Technicals
How to decide which stocks deserve your option trades: the business checks, the chart checks, the events that break a setup, and exactly where to find each one in Signal Desk.
Words to Know in This Lesson
• Fundamentals: Facts about the business itself, such as sales, profit and debt.
• Technicals: What the price chart is doing.
• Free cash flow: The cash a company has left after paying its bills and investing in the business.
• P/E ratio: The stock price divided by a year of earnings per share. It shows how many dollars you pay for each dollar the company earns.
• Moving average: The average price over the last 50 or 200 days. It smooths out daily noise.
• RSI: A 0 to 100 gauge of how hard the price has recently moved.
• Support: A price area where a stock has repeatedly stopped falling.
• Earnings report: The company’s quarterly results.
1. Why the Stock Comes Before the Strike
Every option is a bet on a stock, and the premium you collect or pay is the market's price for the risk in that stock. That creates a trap: the richest premiums sit on the shakiest stocks, because that is where the market sees the most risk. A beginner who sorts a screen by premium is, without knowing it, sorting for trouble.
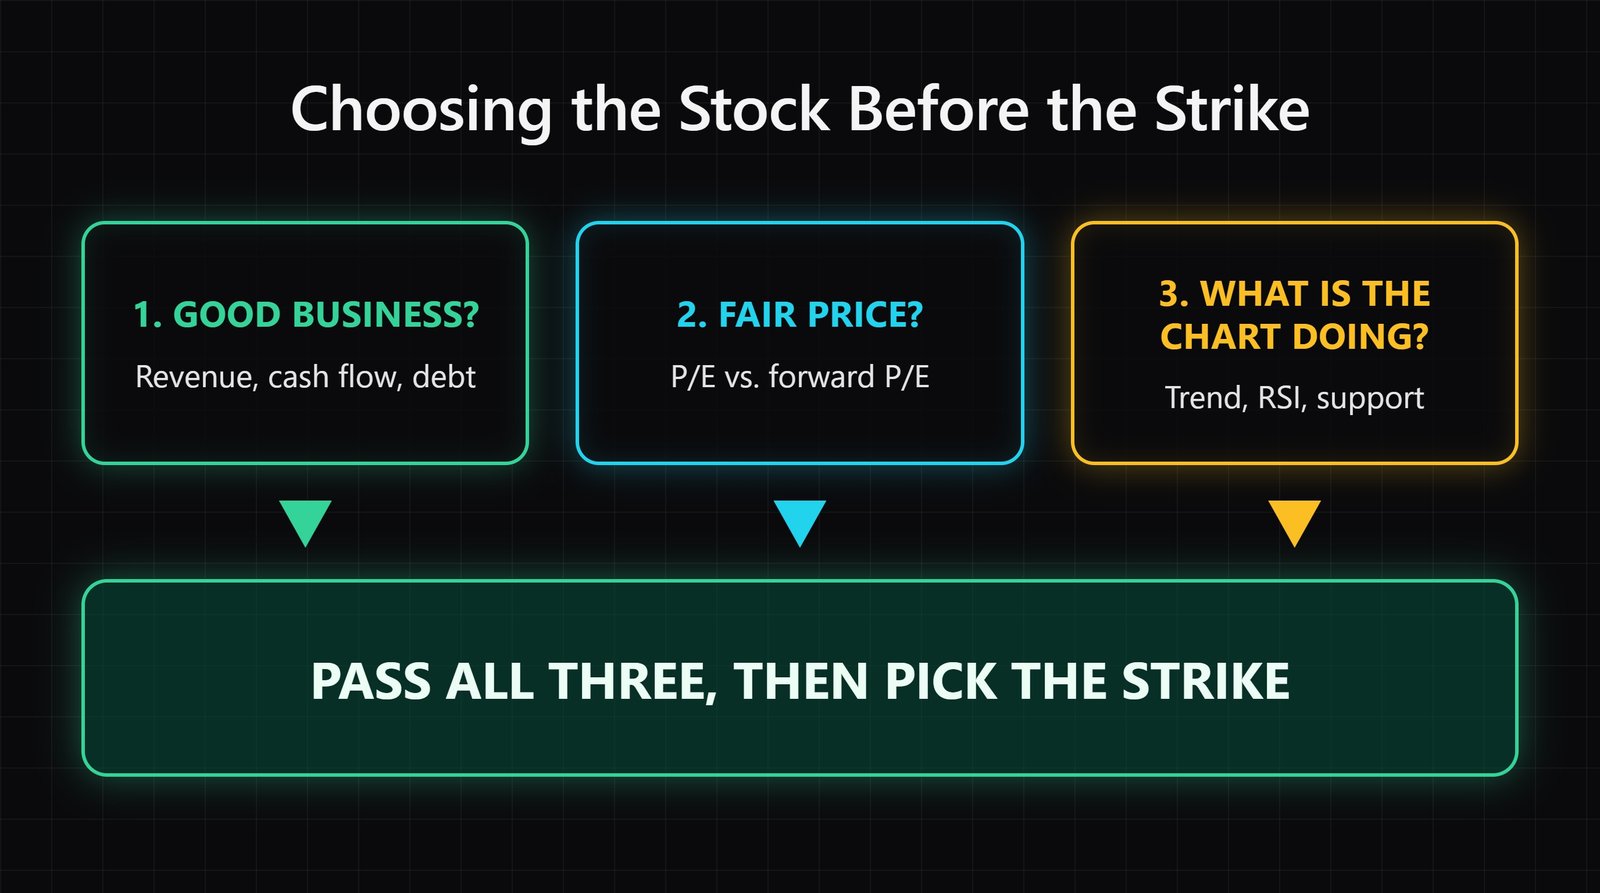
So the first decision is never the strike or the date. It is the stock. Three questions, in order:
• Is it a good business? (Fundamentals)
• Is the price reasonable for what you get? (Valuation)
• What is the chart doing right now? (Technicals)
★ Core Fact: Fundamentals tell you whether you would want to own the stock. Technicals tell you whether now is a sensible time to act. Neither one predicts the future; together they keep you out of the worst trades.
2. Fundamentals — Is It a Good Business?
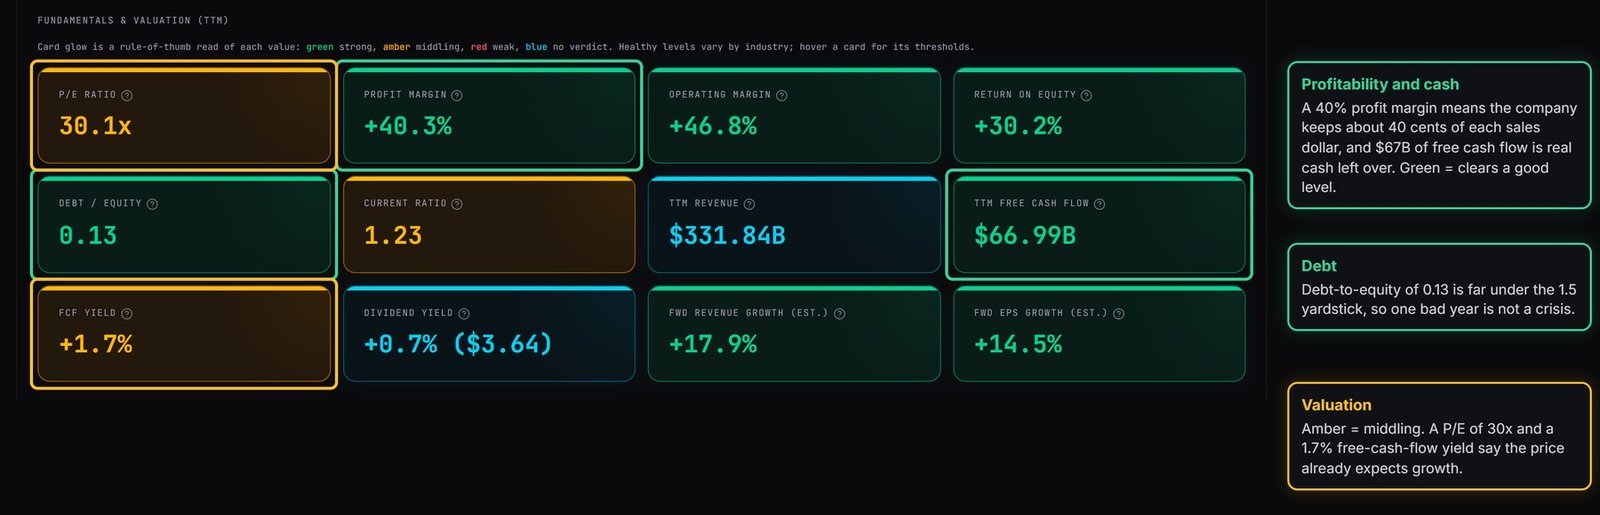
You do not need an analyst's spreadsheet. Five readings cover most of what matters for an options trader:
• Revenue growth: Are sales rising year over year? A shrinking top line is a warning no matter how cheap the stock looks.
• Profitability and free cash flow: Does the company turn sales into real cash? Free cash flow that is positive and growing is the clearest sign of a healthy business.
• Debt: How much does it owe compared with what it owns? A common yardstick is debt-to-equity under about 1.5; much higher means a bad year can become a crisis.
• Earnings trend: Is earnings per share (EPS) rising? A one-off jump matters less than a steady climb.
• Valuation: What are you paying? Compare the P/E ratio (the price divided by a year of earnings per share) with the forward P/E (based on expected earnings). A forward P/E well below the trailing P/E means the market expects earnings to grow.
Worked example: Company A has revenue up 9%, positive and growing free cash flow, debt-to-equity of 0.6, and a forward P/E of 18. Company B has revenue down 4%, negative free cash flow, debt-to-equity of 2.8, and a forward P/E of 7. Company B looks cheaper and its options pay far more. It is also the one more likely to gap down on a bad quarter.
★ Core Fact: A cheap price is not a quality signal. Low valuation is only attractive when the business behind it is healthy.
 Click to enlarge
 Click to enlarge
3. Technicals — What Is the Chart Saying?
Fundamentals say what the company is. The chart says what the market is doing with it right now. Three simple reads are enough to start:
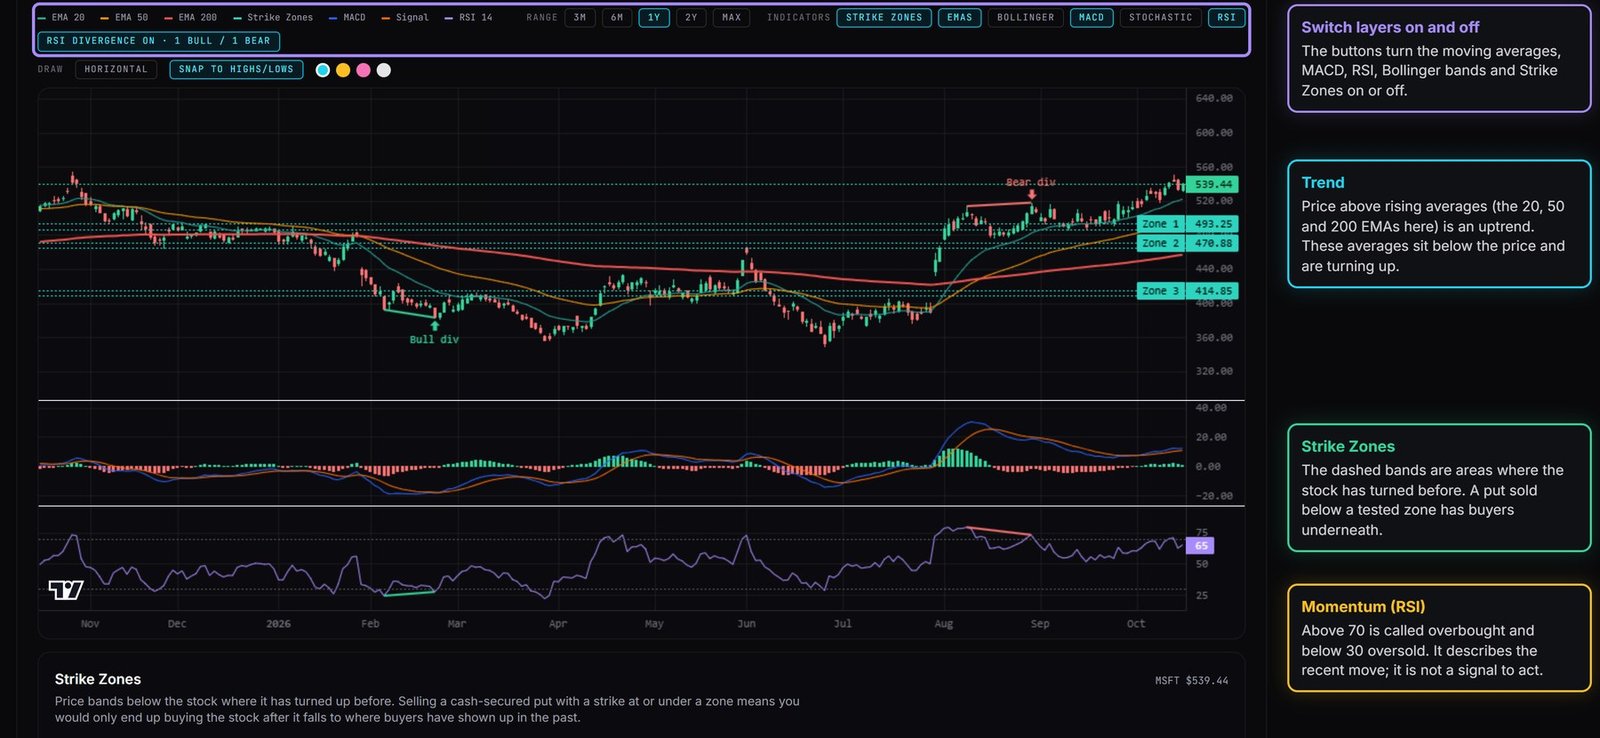
• Trend: Moving averages smooth out daily noise. When the price sits above its 50-day and 200-day averages and those lines slope upward, the stock is in an uptrend. When it sits below falling averages, it is in a downtrend.
• Momentum: The RSI (Relative Strength Index) measures how hard the price has moved on a 0 to 100 scale. Above 70 is often called overbought, below 30 oversold. These are descriptions of a recent move, not buy or sell commands.
• Support: Prices where a stock has repeatedly stopped falling and bounced. A put sold below a well-tested support area has a floor of buyers underneath it. In Signal Desk these areas are called Strike Zones.
⚠️ Risk Warning: A stock that has fallen hard and shows an oversold RSI can keep falling. Selling a put into a falling stock only makes sense if you genuinely want the shares at that price, and not because the premium looks large.
 Click to enlarge
4. The Events That Break a Setup
A good stock on a good chart can still hand you a bad trade if something is about to happen. Check these before every trade:
• Earnings date: A company's report can move the stock 5 to 15 percent overnight. Premium is higher before earnings because of this, but a gap can carry the price past your strike with no chance to react. Know whether a report lands before your expiration.
• Recent news: A lawsuit, an investigation, a guidance cut or a merger announcement changes the picture faster than any indicator.
• Insider trades: Read them with care. Insiders sell routinely for taxes and diversification, so a few sales on their own tell you very little. Open-market purchases are far rarer and carry more information.
★ Practical Guidance: If an earnings report falls inside your trade window, treat it as a deliberate choice, not an accident. Many income traders simply pick an expiration before the report.
 Click to enlarge
5. A Pass/Fail Checklist
Put the pieces together as a short checklist you run before any option trade. If a line fails, skip the stock for now. There is always another setup next week.
• I would be glad to own this company for a year.
• Revenue is growing or stable, and free cash flow is positive.
• Debt is manageable and earnings are not collapsing.
• The price is not in free fall: it sits above, or is recovering toward, its 50-day average, or it is sitting at a tested support area.
• No earnings report or major event lands inside my trade window, unless that is my deliberate plan.
★ Core Fact: The checklist does not find winners. It removes the trades most likely to hurt you, and avoiding those is most of the edge in options income.
6. Try It in Signal Desk
Choose two stocks: one large, familiar company, and one you have been tempted by only because its options pay a lot.
Open each one in Stock Research and run the checklist above using the radar, the fundamentals cards and the chart. Write down pass or fail on each line, then open the Grader for the same two tickers and compare its letter grade with your own verdict.
The gap between the two stocks, and how rich the second one's premium looked before you checked it, is the lesson. You already know how to read the option chain from Lesson 1.5; once a stock passes, Module 2 explains the Greeks, the numbers that show how an option will behave.
See it in Signal Desk
Everything in this lesson is on one screen. Follow these steps with any ticker (members see live data).
- 1
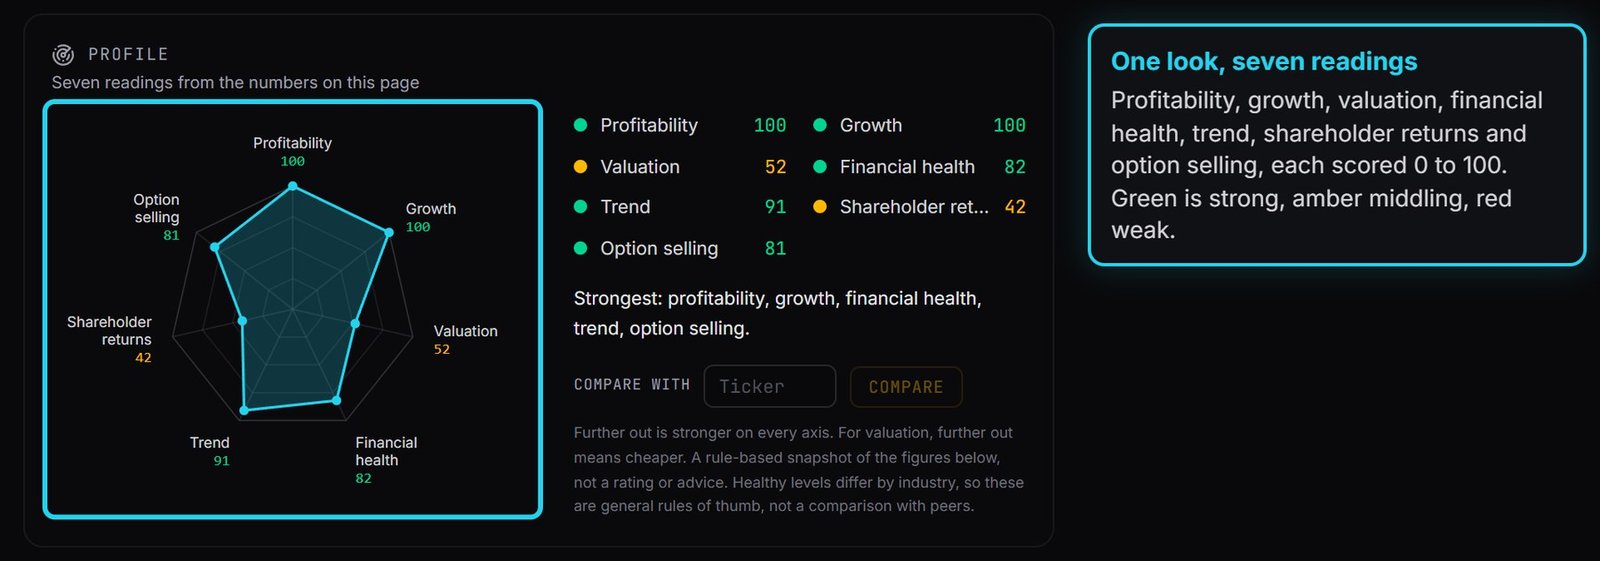
Open Stock Research and type a ticker such as MSFT or KO. The top of the page shows what the company does, where it is based, and when it was founded, next to a seven-axis radar that scores profitability, growth, valuation, financial health, trend, shareholder returns and option selling.
- 2
Click an axis on the radar to see the exact figures behind its score, then use "See the numbers" to jump to the matching cards. Each figure is colored green when it clears a good level and red when it is weak, so you can scan for problems in seconds.
- 3
Under the radar, use the chart toggles to show the moving averages, RSI and Strike Zones. Look at where the price sits against its averages and whether the Strike Zones sit well below it.
- 4
The line above the chart shows the next earnings date. Check it, then scroll down for recent news, insider trades and holders of more than 5% of the company.
- 5
Open the Grader for a quick growth-quality letter grade across eight criteria, and the Market tab to see today's candidates that already pass a quality bar.
KNOWLEDGE RECONNAISSANCE
Why is choosing a stock only by the size of its option premium risky?
A company's revenue is growing, but its free cash flow is negative and its debt keeps rising. What does this most likely suggest?
A stock sits far below its 50-day and 200-day averages and its RSI is 22. Which statement is most accurate?
Why check the earnings date before selling a put?
You notice several insider sales at a company you like. How much weight should that get by itself?
More lessons in this module
- 1.0: Introduction to Options & Contract Specifications
- 1.1: Call Options — Buying and Selling Mechanics
- 1.2: Put Options — Buying and Selling Mechanics
- 1.3: Option Moneyness & Value Structure
- 1.4: Option Pricing — Intrinsic vs. Extrinsic Value
- 1.5: Reading an Option Chain
Signal Desk is where you practice this on real stocks: real option chains (about 15 minutes delayed), the Trade Check and a paper-trading account that risks no real money. Join to add it, your progress tracking and PDF downloads.