
A hands-on options curriculum covering real trading concepts. Read the lessons, work through examples, and test your knowledge.
OVERALL ACADEMY PROGRESS
Free Lesson
Every lesson is free to read. Subscribe to add Signal Desk, progress tracking, PDF downloads and the lesson tutor.
Key terms in this lesson
 Click to enlarge
Lesson 6: 1.5: Reading an Option Chain
Every column on a broker's option chain explained, plus how to spot an untradeable contract before you place an order.
Words to Know in This Lesson
• Option chain: The list of every strike and expiration for one stock, with prices.
• Bid: The most a buyer will pay right now. It is what you get if you sell.
• Ask: The least a seller will accept right now. It is what you pay if you buy.
• Bid-ask spread: The gap between the bid and the ask. A wide gap is a hidden cost.
• Volume: How many contracts traded today.
• Open interest: How many contracts exist right now and have not been closed.
• Liquidity: How easy it is to buy or sell at a fair price. A liquid contract has plenty of buyers and sellers.
• Days to expiration (DTE): How many days remain until the contract ends.
• Weekly, monthly and LEAPS: Contracts that end every Friday, on the third Friday of the month, or more than a year away.
1. The Layout
The option chain is the screen where every options decision actually happens, and most platforms present it identically once you know what you are looking at.
• Strikes run vertically down the centre, from low at the top to high at the bottom.
• Calls occupy one side (conventionally the left), puts the other.
• An expiration selector at the top switches between contract dates.
• In-the-money (ITM) contracts are usually shaded or highlighted, and that shading flips sides between calls and puts — exactly the mirroring from Lesson 1.3.
Each expiration is effectively its own market. The $100 call expiring in 7 days and the $100 call expiring in 90 days are entirely different instruments with different prices and different behaviour.
2. The Columns That Matter
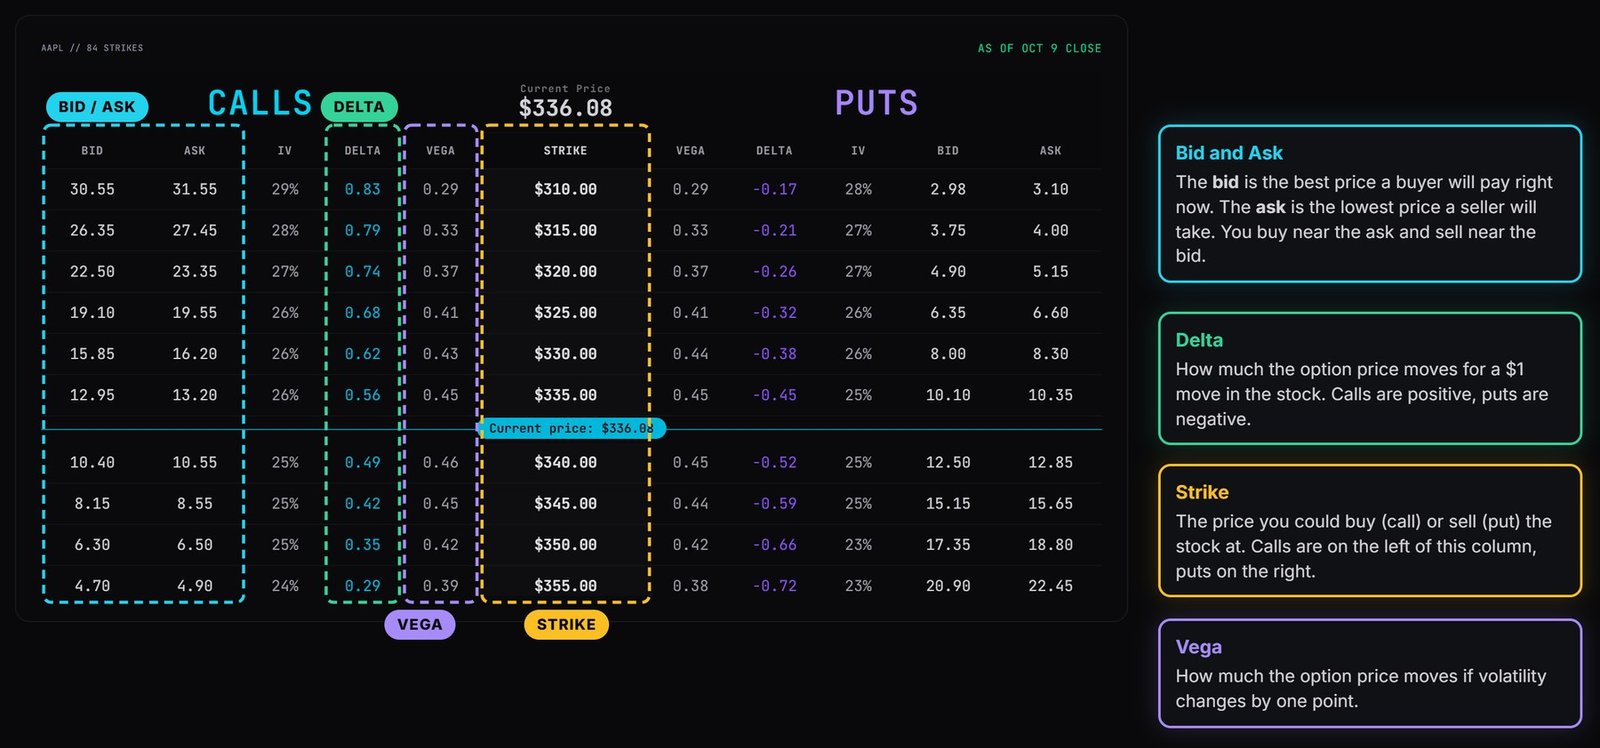
A default chain shows more columns than you need. These are the ones that drive decisions:
• Bid — the highest price a buyer will currently pay. This is what you receive if you sell at market.
• Ask — the lowest price a seller will accept. This is what you pay if you buy at market.
• Last — the price of the most recent trade. Can be stale and misleading on illiquid contracts; never price a trade off it.
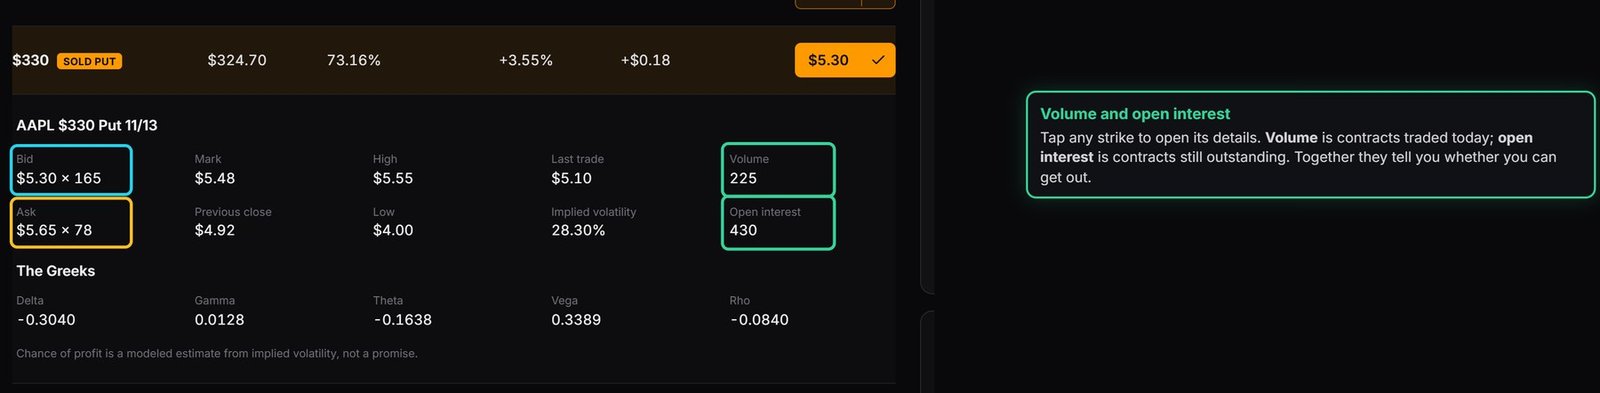
• Volume — contracts traded today. Resets to zero each morning.
• Open Interest — total contracts currently outstanding. Accumulated over time, not daily.
• Implied Volatility (IV) — the market's expected future movement, expressed as an annualized percentage.
• Delta — directional sensitivity, and a rough ITM probability estimate.
★ Practical Rule: Bid, ask, volume, and open interest tell you whether you can trade a contract at a fair price. IV and delta tell you whether you should want to.
 Click to enlarge
3. Volume vs. Open Interest
These two are constantly confused and they measure different things.
Volume counts today's transactions. A contract with volume of 500 changed hands 500 times since the open.
Open interest counts contracts that exist right now and have not been closed or expired. It builds up over days and weeks.
Worked interpretation:
• High OI, high volume: A liquid, actively traded contract. Easy to enter and exit. This is what you want.
• High OI, low volume: Established positions, quiet today. Usually still tradeable.
• Low OI, low volume: Nearly nobody is trading this. Spreads will be wide and exiting may be difficult or expensive.
⚠️ Risk Warning: Entering a low open-interest contract is easy. Exiting it is the problem. You may find no reasonable bid when you need out, forcing you to accept a poor price or hold to expiration.
 Click to enlarge
4. A Liquidity Screen You Can Apply in Seconds
Before considering any contract, run this check. It takes about five seconds and prevents a large share of avoidable losses.
• Open interest above 100, ideally above 500.
• Bid-ask spread under roughly 10% of the mid-price. On a $2.00 mid, a spread wider than about $0.20 is a warning.
• A real bid exists. A bid of $0.00 means nobody will buy it from you at any price.
• Strikes are evenly spaced with quotes on both sides.
Concrete comparison — stock at $100, $105 call, 45 days to expiration:
• Liquid: Bid $1.45 / Ask $1.55, OI 2,400. Spread is $0.10 on a $1.50 mid — about 6.7%. Acceptable.
• Illiquid: Bid $1.10 / Ask $1.90, OI 12. Spread is $0.80 on a $1.50 mid — over 50%. If you buy at $1.90 and sell at $1.10, you lose about 40% of your money before the stock moves at all. Avoid.
★ Core Fact: The spread is a real, immediate cost. On the illiquid contract above, the stock must move meaningfully in your favour just to recover the cost of entering and exiting.
5. Weeklies, Monthlies, and Which to Use
Most liquid underlyings list several expiration types:
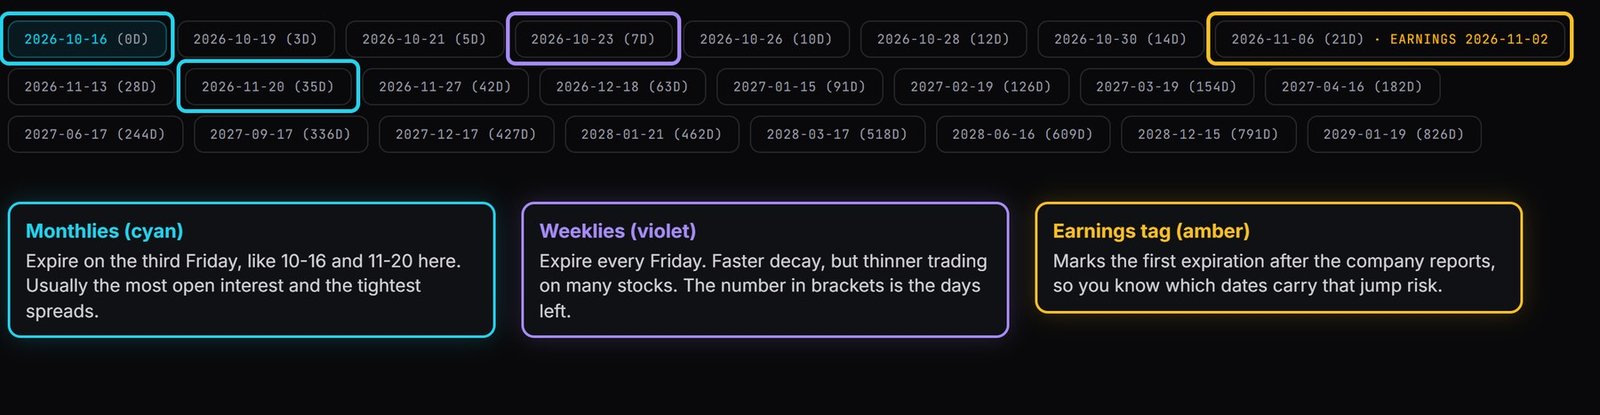
• Weeklies — expire each Friday. Fastest time decay (called theta), but typically thinner liquidity and wider spreads on smaller names.
• Monthlies — expire the third Friday of each month. Generally the most liquid contracts, with the tightest spreads and deepest open interest.
• LEAPS — expirations beyond one year out. Used for long-horizon positions; wide spreads are common.
For most strategies in this course, monthly expirations 30 to 45 days out offer the best combination of meaningful premium, manageable decay, and reliable liquidity.
★ Practical Guidance: When starting out, trade monthly expirations on large, well-known underlyings. You give up a little theta and gain a great deal in execution quality.
 Click to enlarge
6. Try It in Signal Desk
Open the Options page in Signal Desk and load a chain for a large, liquid name such as AAPL. Pick a monthly expiration roughly 45 days out and note the bid and ask for a strike about 5% below the current price.
Now load a smaller, less-followed stock and compare the same relative strike. Write down both bid-ask spreads as a percentage of the midpoint. The difference is usually dramatic, and it makes concrete why liquidity is a selection criterion rather than an afterthought.
Then open the Easy Chain, tap a strike on each stock and read its open interest and volume. Run the five-second liquidity screen from section 4 on both contracts, and repeat the comparison between a weekly and a monthly on the same stock.
See it in Signal Desk
The Options page shows real strikes, expirations and bid/ask quotes, not modeled ones (members see live quotes).
- 1
Open Options, type a ticker and press Load chain. Start with a large, liquid name such as AAPL or SPY.
- 2
The buttons across the top are expirations, and the number in brackets is the days until each one expires. Pick one 30 to 45 days out.
- 3
Calls are on the left and puts on the right, with strikes down the middle. Each row shows bid, ask, implied volatility (IV), delta and vega. Bid is what you can sell for, and ask is what you pay.
- 4
Look for the earnings tag: the first expiration that includes the next earnings report is marked, so you know which dates carry that risk.
- 5
Prefer the brokerage-style view? Switch to the Easy Chain: pick Buy or Sell, Call or Put, a date and a strike, then tap a strike to see its open interest, volume, IV, Greeks and chance of profit.
Try it with your own numbers
Free calculators, no account needed.
KNOWLEDGE RECONNAISSANCE
What does Open Interest measure?
A contract shows Bid $1.10 / Ask $1.90 with open interest of 12. What is the main concern?
Why should you avoid pricing a trade off the 'Last' column?
Which expiration type generally offers the best liquidity and tightest spreads?
A contract shows a bid of $0.00. What does this mean practically?
Using the quick liquidity screen, which contract passes?
More lessons in this module
- 1.0: Introduction to Options & Contract Specifications
- 1.1: Call Options — Buying and Selling Mechanics
- 1.2: Put Options — Buying and Selling Mechanics
- 1.3: Option Moneyness & Value Structure
- 1.4: Option Pricing — Intrinsic vs. Extrinsic Value
- 1.6: Choosing the Stock — Fundamentals and Technicals
Signal Desk is where you practice this on real stocks: real option chains (about 15 minutes delayed), the Trade Check and a paper-trading account that risks no real money. Join to add it, your progress tracking and PDF downloads.