
A hands-on options curriculum covering real trading concepts. Read the lessons, work through examples, and test your knowledge.
OVERALL ACADEMY PROGRESS
Free Lesson
Every lesson is free to read. Subscribe to add Signal Desk, progress tracking, PDF downloads and the lesson tutor.
Key terms in this lesson
Lesson 7: 12.7: Absorption
Spot passive institutional orders blocking aggressive market sweeps.
1. The Absorption Process
Absorption is an order flow phenomenon where a large passive limit order (or iceberg) absorbs all the aggressive market orders of the opposing side, preventing price from moving past that level.
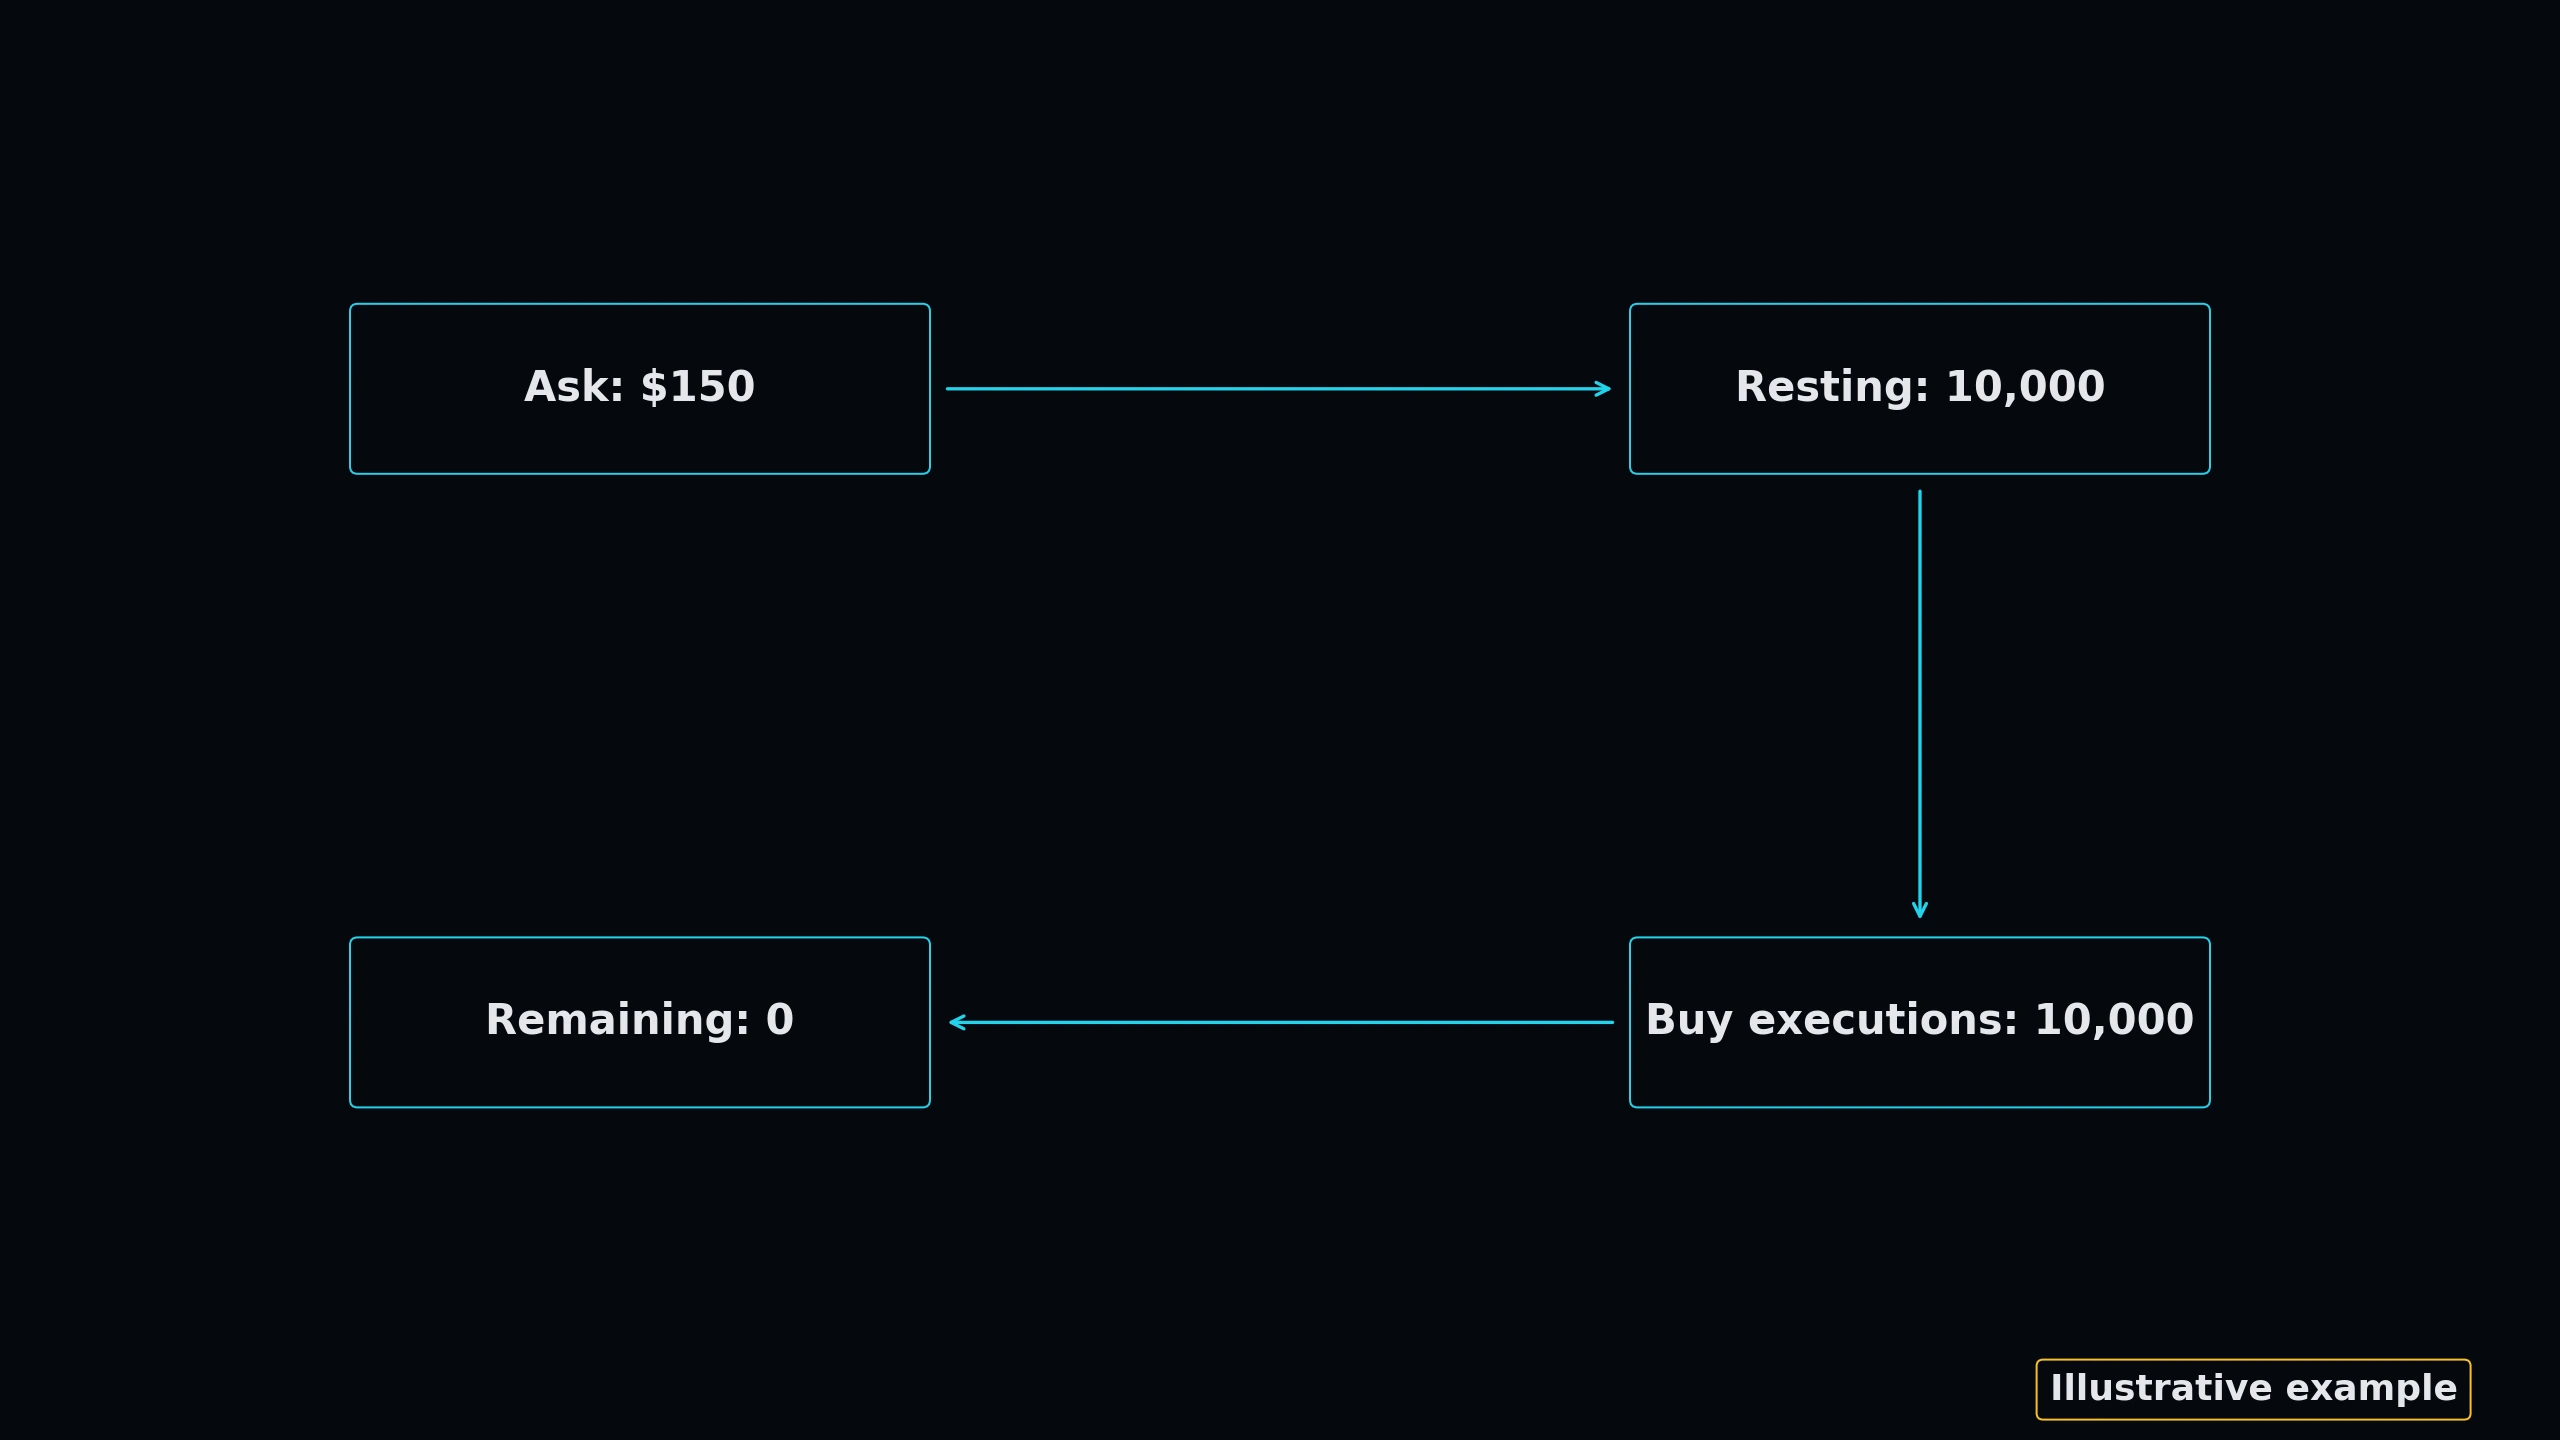
For example, if aggressive buyers submit 10,000 market buy contracts at $150, but a passive institution has placed a limit sell order of 10,000 contracts at $150, price will not tick up to $150.01. The buyers' aggressive volume is completely absorbed.
★ Reversal Warning: Absorption is a classic precursor to a market reversal. When aggressive traders realize their orders are failing to push price further, they panic and liquidate.
2. Identifying Absorption on Charts
Absorption is visible on a footprint chart when a price level has extremely high volume on the Ask (or Bid) but price fails to break through, forming a flat wick or capping candle. It is also flagged by large negative delta on a candle that closes green (or vice versa).
 Click to enlarge
GEX Heatmap & Dealer Hedging Profile
The Gamma Exposure (GEX) profile dictates the hedging loops of market-makers. Slide the price pointer below to see how institutional hedging flows suppress volatility or trigger cascading market trends.
Price Controller
Gamma Transition Zone (Near $100): Resting near the Volatility Flip Line. Dealer hedging is transitioning, making the price range choppy as dealer flows oscillate. Expect choppy intraday price ranges.
KNOWLEDGE RECONNAISSANCE
What occurs during institutional 'Absorption' at a resistance level?
More lessons in this module
- 12.0: Introduction to Order Flow
- 12.1: Order Flow Basics
- 12.2: Bid vs. Ask Mechanics
- 12.3: Market Orders
- 12.4: Limit Orders
- 12.5: Footprint Charts
- 12.6: Delta
- 12.8: Order Flow Trading Strategies
Signal Desk is where you practice this on real stocks: real option chains (about 15 minutes delayed), the Trade Check and a paper-trading account that risks no real money. Join to add it, your progress tracking and PDF downloads.