
A hands-on options curriculum covering real trading concepts. Read the lessons, work through examples, and test your knowledge.
OVERALL ACADEMY PROGRESS
Free Lesson
Every lesson is free to read. Subscribe to add Signal Desk, progress tracking, PDF downloads and the lesson tutor.
Key terms in this lesson
Lesson 5: 12.5: Footprint Charts
Learn how to read multidimensional footprint charts that display executed bid/ask volumes inside every bar.
1. Deciphering the Footprint Chart
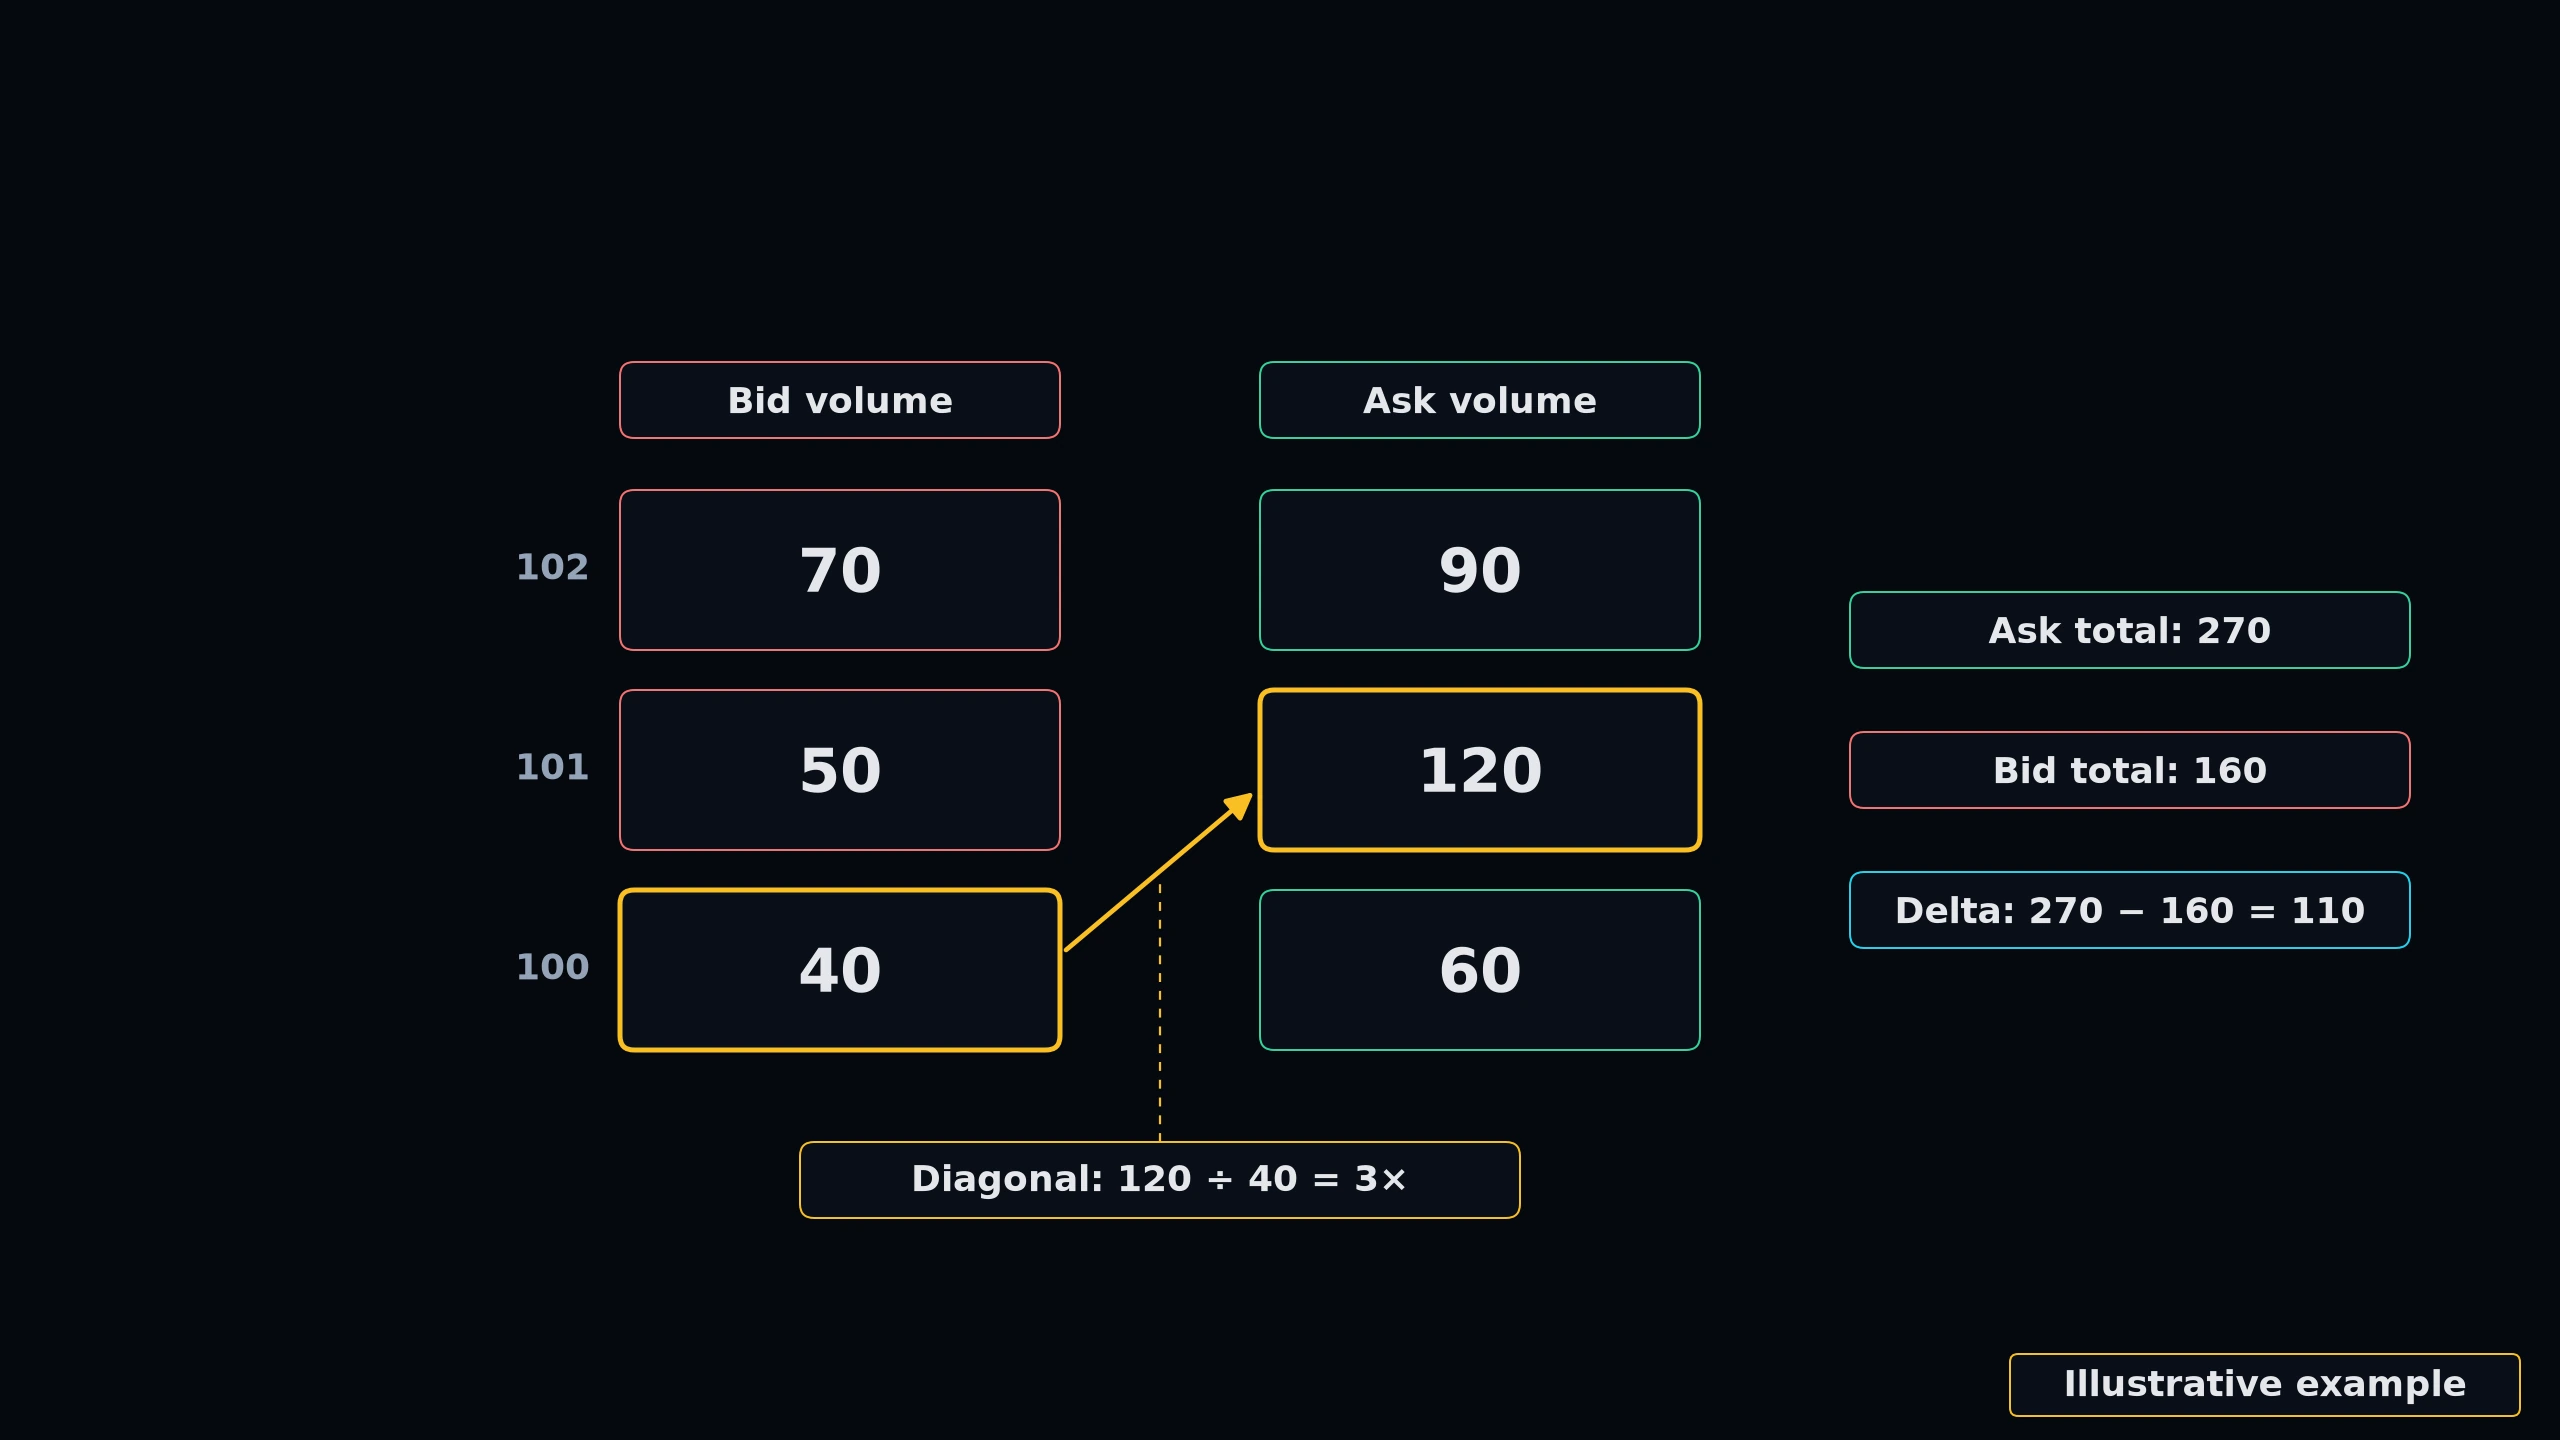
A Footprint Chart (also known as a Bid/Ask profile chart) is a multidimensional price bar that displays the exact volume executed at the Bid and Ask for every single price row inside a candle.
Instead of seeing a solid green or red candle, a footprint trader sees a grid of numbers (e.g., 120 x 450) at each price tick, representing contracts traded at the Bid on the left, and contracts traded at the Ask on the right.
★ Imbalance Highlights: Footprint software highlights diagonal imbalances where aggressive buying heavily outweighs selling (or vice versa) on a relative percentage basis.
2. Buying and Selling Imbalances
• Buying Imbalance: When buy market orders at the Ask are significantly larger (typically 300% to 400% larger) than sell market orders at the Bid one tick below.
• Selling Imbalance: When sell market orders at the Bid are significantly larger than buy market orders at the Ask one tick above.
Multiple stacked imbalances form powerful support or resistance zones.
 Click to enlarge
GEX Heatmap & Dealer Hedging Profile
The Gamma Exposure (GEX) profile dictates the hedging loops of market-makers. Slide the price pointer below to see how institutional hedging flows suppress volatility or trigger cascading market trends.
Price Controller
Gamma Transition Zone (Near $100): Resting near the Volatility Flip Line. Dealer hedging is transitioning, making the price range choppy as dealer flows oscillate. Expect choppy intraday price ranges.
KNOWLEDGE RECONNAISSANCE
On a footprint chart, how are imbalances compared to detect aggressive participation?
More lessons in this module
- 12.0: Introduction to Order Flow
- 12.1: Order Flow Basics
- 12.2: Bid vs. Ask Mechanics
- 12.3: Market Orders
- 12.4: Limit Orders
- 12.6: Delta
- 12.7: Absorption
- 12.8: Order Flow Trading Strategies
Signal Desk is where you practice this on real stocks: real option chains (about 15 minutes delayed), the Trade Check and a paper-trading account that risks no real money. Join to add it, your progress tracking and PDF downloads.