
A hands-on options curriculum covering real trading concepts. Read the lessons, work through examples, and test your knowledge.
OVERALL ACADEMY PROGRESS
Free Lesson
Every lesson is free to read. Subscribe to add Signal Desk, progress tracking, PDF downloads and the lesson tutor.
Key terms in this lesson
Lesson 6: 12.6: Delta
Analyze order flow delta, cumulative delta, and delta divergence to find structural trend shifts.
1. Understanding Order Flow Delta
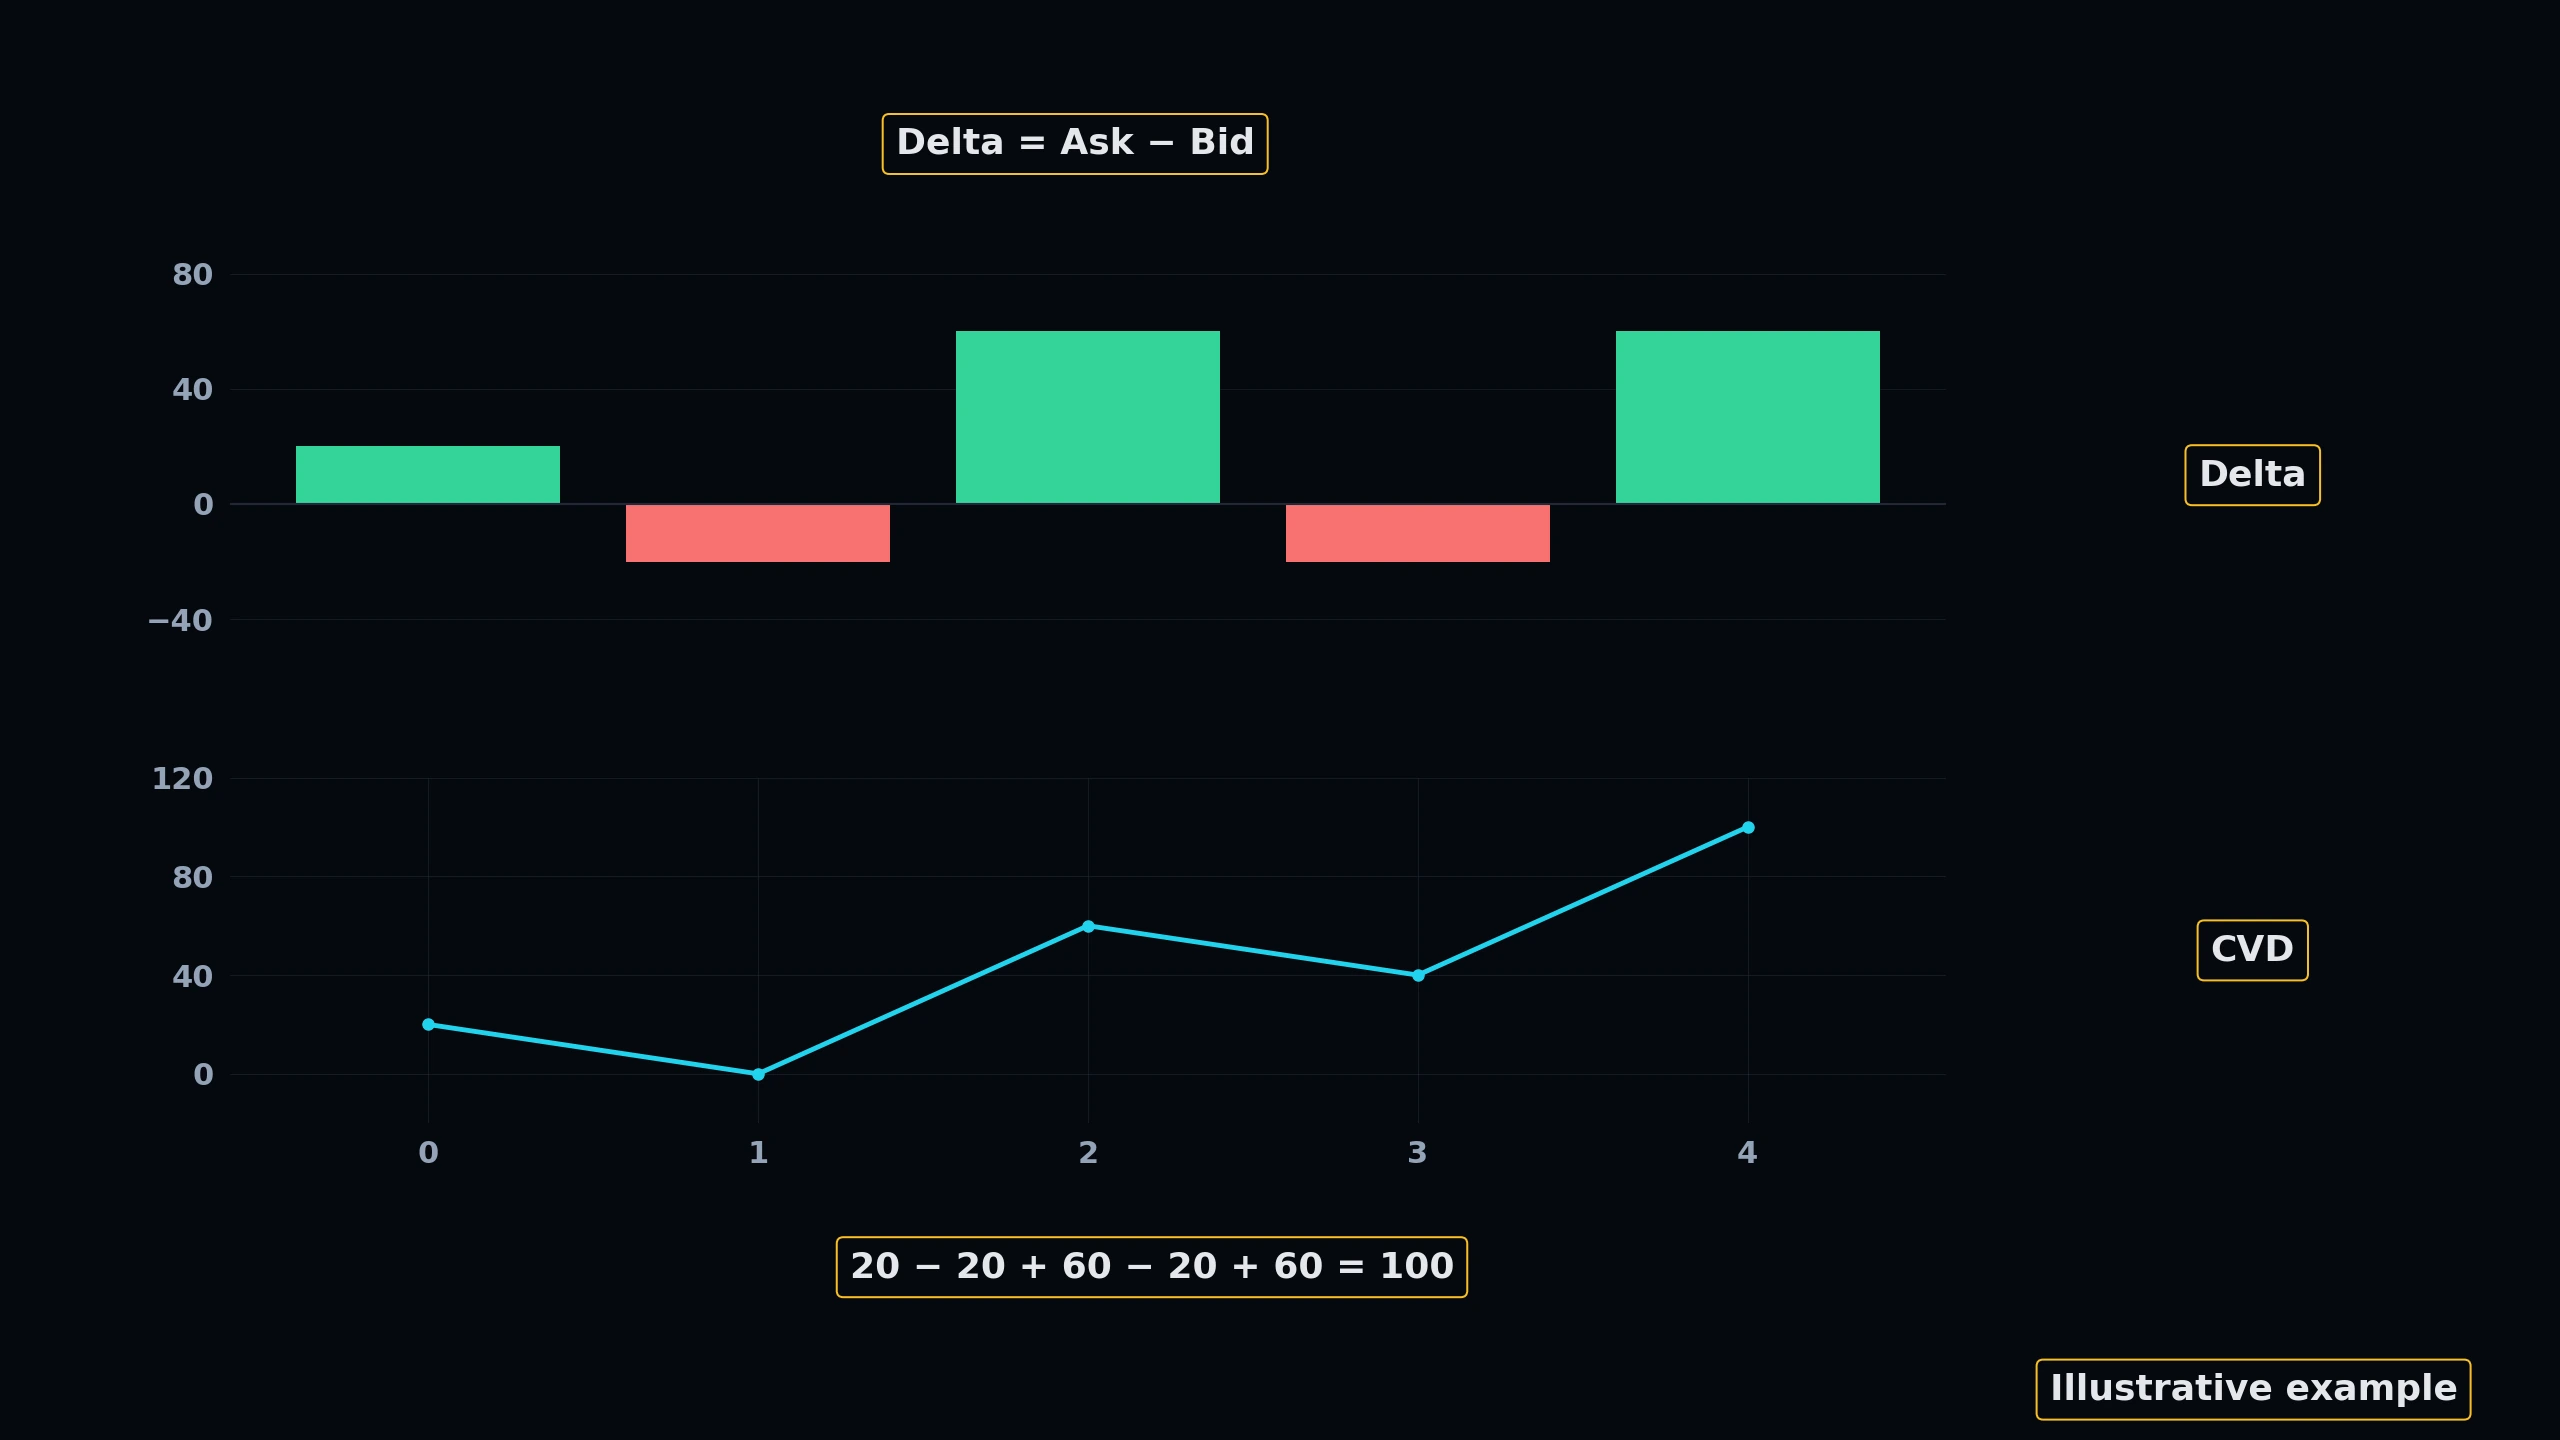
In order flow, Delta is the net difference between aggressive buying volume (Ask trades) and aggressive selling volume (Bid trades) over a given period.
• Formula: Delta = Ask Volume - Bid Volume.
If Delta is positive, it means there were more contracts bought aggressively at the Ask. If negative, more contracts were sold aggressively at the Bid.
★ Cumulative Volume Delta (CVD): Is the running sum of all intraday deltas, plotting a continuous line that tracks net aggressive pressure over the entire session.
2. Delta Divergence
Delta Divergence occurs when price makes a new high but CVD fails to make a new high, or makes a lower high. This signals that the price upward movement is lacking aggressive buying conviction, indicating a high-probability reversal setup.
 Click to enlarge
GEX Heatmap & Dealer Hedging Profile
The Gamma Exposure (GEX) profile dictates the hedging loops of market-makers. Slide the price pointer below to see how institutional hedging flows suppress volatility or trigger cascading market trends.
Price Controller
Gamma Transition Zone (Near $100): Resting near the Volatility Flip Line. Dealer hedging is transitioning, making the price range choppy as dealer flows oscillate. Expect choppy intraday price ranges.
KNOWLEDGE RECONNAISSANCE
What is Cumulative Volume Delta (CVD)?
More lessons in this module
- 12.0: Introduction to Order Flow
- 12.1: Order Flow Basics
- 12.2: Bid vs. Ask Mechanics
- 12.3: Market Orders
- 12.4: Limit Orders
- 12.5: Footprint Charts
- 12.7: Absorption
- 12.8: Order Flow Trading Strategies
Signal Desk is where you practice this on real stocks: real option chains (about 15 minutes delayed), the Trade Check and a paper-trading account that risks no real money. Join to add it, your progress tracking and PDF downloads.