
A hands-on options curriculum covering real trading concepts. Read the lessons, work through examples, and test your knowledge.
OVERALL ACADEMY PROGRESS
Free Lesson
Every lesson is free to read. Subscribe to add Signal Desk, progress tracking, PDF downloads and the lesson tutor.
Lesson 11: 6.10: Pattern Failure & Trap Mechanics
Understand why chart patterns fail, how to identify bull/bear traps, and manage risk during failed breakouts.
1. The Reality of Failed Breakouts
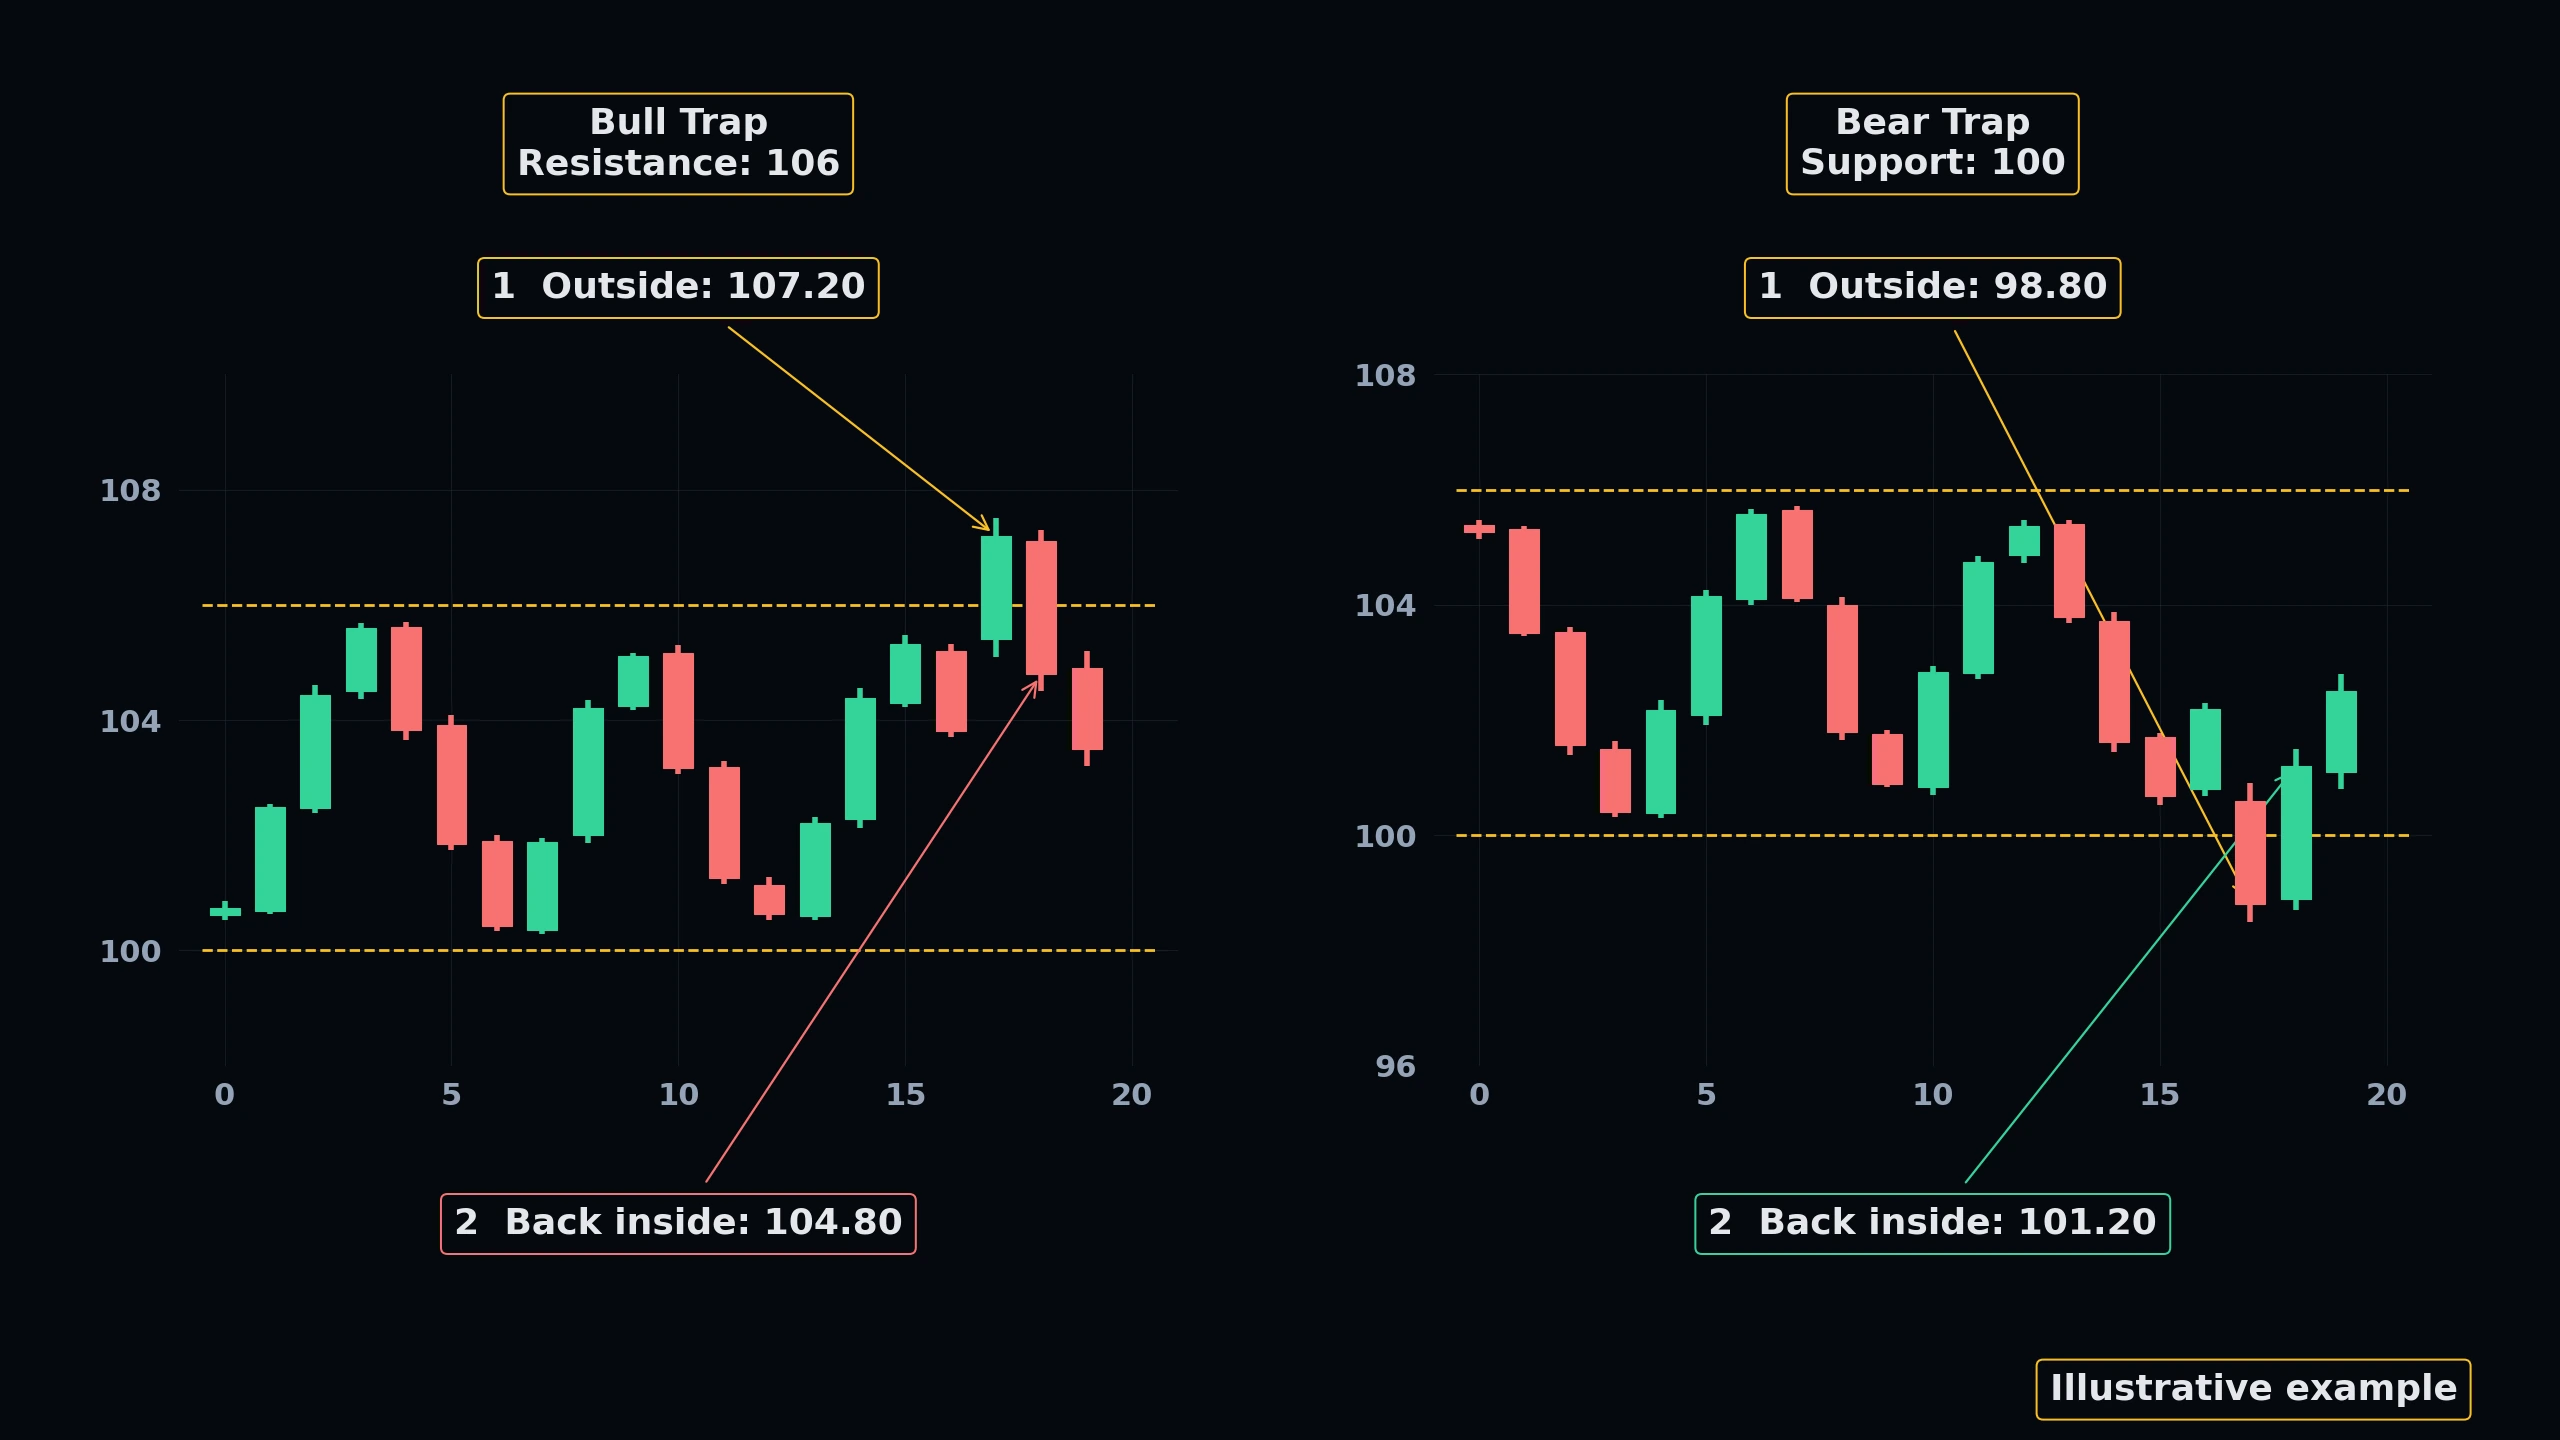
No chart pattern is 100% reliable. In fact, failed chart patterns (often called traps) can offer some of the most lucrative and rapid trading opportunities if handled correctly.
A Bull Trap occurs when price breaks above a key pattern resistance line, enticing breakout traders to buy, but immediately reverses back into the pattern. This traps the breakout buyers, whose stop-loss orders (selling) fuel a sharp move lower.
★ Risk Management Rule: Always place a stop-loss inside the pattern boundary to protect your capital from sudden trap reversals.
 Click to enlarge
Technical Market Structure Blueprint
Interactively map key institutional Price Action patterns. Switch between the 4 technical blueprints below and click the glowing blue hotspots to dissect the market mechanics.
Pattern Technical Explainer
Select any glowing node on the technical chart to inspect the institutional structure details.
KNOWLEDGE RECONNAISSANCE
What is a 'Bull Trap' in breakout trading?
More lessons in this module
- 6.0: Introduction to Chart Patterns
- 6.1: Flag Patterns
- 6.2: Pennant Patterns
- 6.3: Triangle Formations
- 6.4: Wedge Patterns
- 6.5: Channel Trading Mechanics
- 6.6: Head and Shoulders Formations
- 6.7: Double Tops and Bottoms
- 6.8: Cup and Handle Pattern
- 6.9: Ascending and Descending Triangle Breakouts
Signal Desk is where you practice this on real stocks: real option chains (about 15 minutes delayed), the Trade Check and a paper-trading account that risks no real money. Join to add it, your progress tracking and PDF downloads.