
A hands-on options curriculum covering real trading concepts. Read the lessons, work through examples, and test your knowledge.
OVERALL ACADEMY PROGRESS
Free Lesson
Every lesson is free to read. Subscribe to add Signal Desk, progress tracking, PDF downloads and the lesson tutor.
Lesson 7: 6.6: Head and Shoulders Formations
Deconstruct the structural psychology of Standard and Inverse Head & Shoulders patterns.
1. The Head and Shoulders Pattern
The Head and Shoulders is one of the most reliable major trend reversal patterns. It consists of a left shoulder (a peak followed by a decline), a head (a higher peak followed by a decline to the neck line), and a right shoulder (a lower peak followed by a decline).
Psychologically, the right shoulder represents a critical failure of buyers to push the asset back to its highs, signaling that demand is exhausted.
The Inverse Head and Shoulders is the bullish equivalent, forming at the bottom of a downtrend and signaling accumulation.
★ Confirmation Rule: You must wait for the price to break and close beyond the neckline support (or resistance for Inverse) before initiating a position.
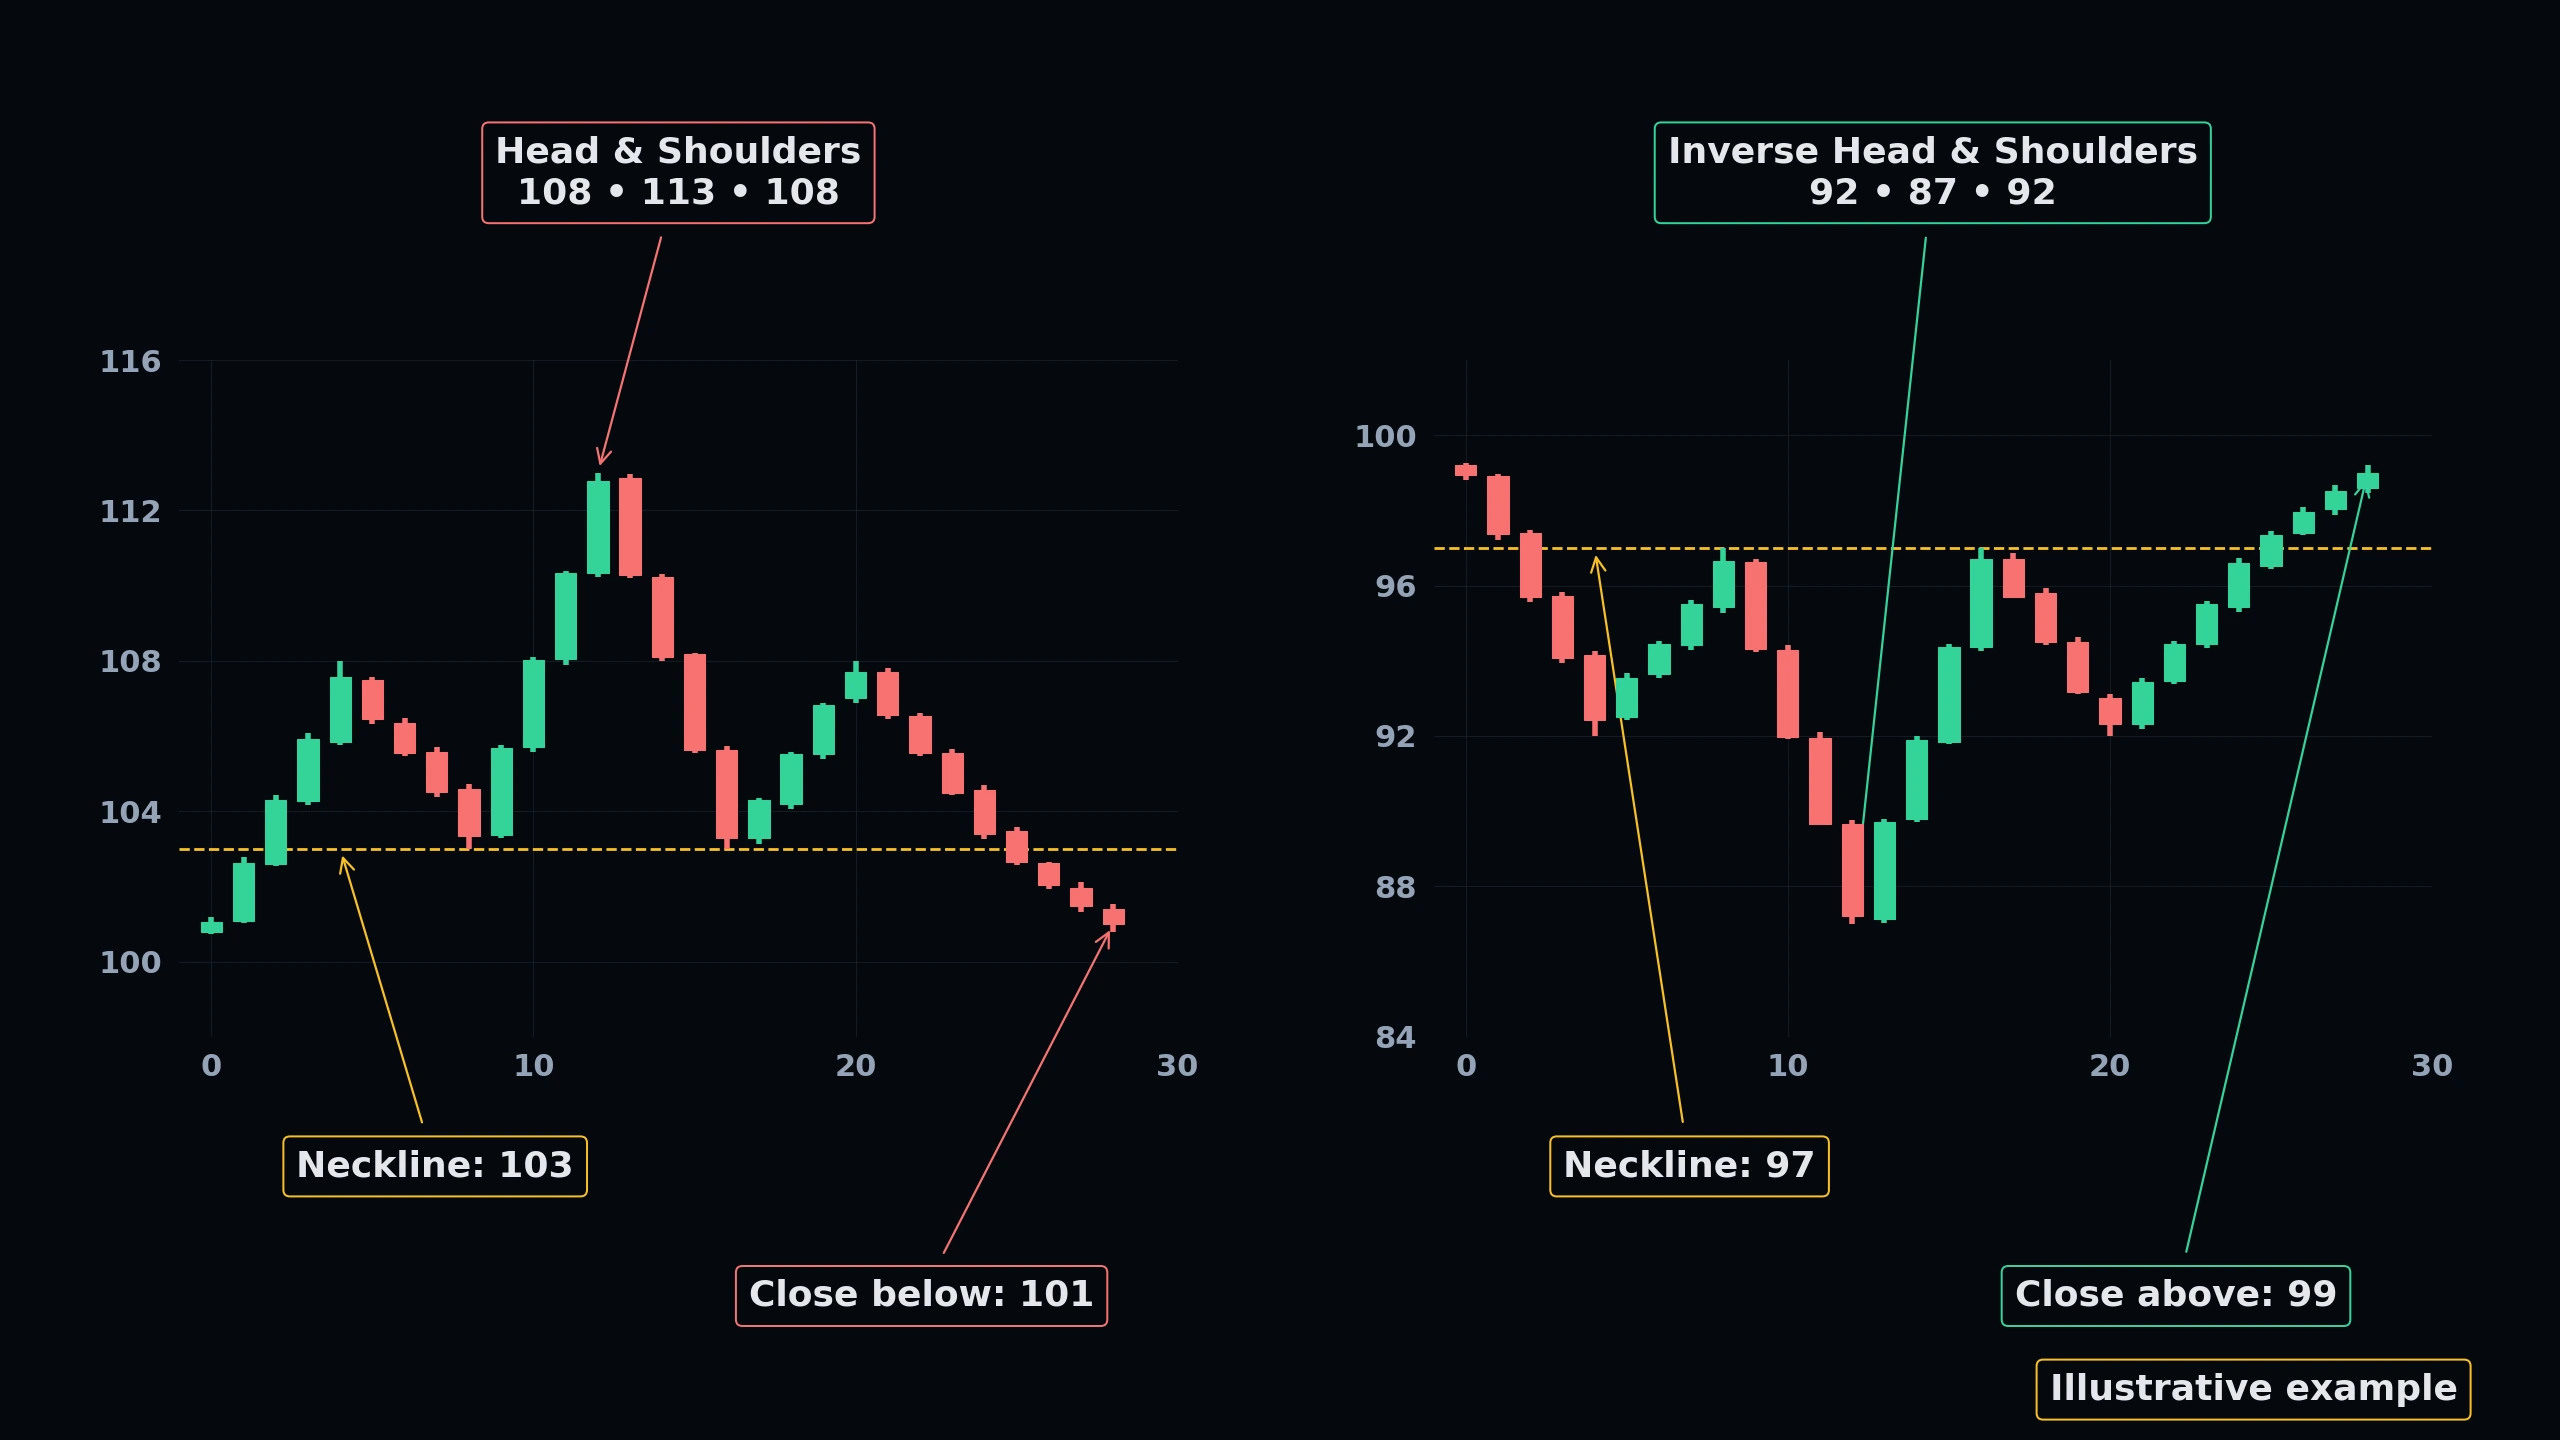 Click to enlarge
Technical Market Structure Blueprint
Interactively map key institutional Price Action patterns. Switch between the 4 technical blueprints below and click the glowing blue hotspots to dissect the market mechanics.
Pattern Technical Explainer
Select any glowing node on the technical chart to inspect the institutional structure details.
KNOWLEDGE RECONNAISSANCE
What does the formation of the 'Right Shoulder' represent in the psychology of a Head and Shoulders pattern?
More lessons in this module
- 6.0: Introduction to Chart Patterns
- 6.1: Flag Patterns
- 6.2: Pennant Patterns
- 6.3: Triangle Formations
- 6.4: Wedge Patterns
- 6.5: Channel Trading Mechanics
- 6.7: Double Tops and Bottoms
- 6.8: Cup and Handle Pattern
- 6.9: Ascending and Descending Triangle Breakouts
- 6.10: Pattern Failure & Trap Mechanics
Signal Desk is where you practice this on real stocks: real option chains (about 15 minutes delayed), the Trade Check and a paper-trading account that risks no real money. Join to add it, your progress tracking and PDF downloads.