
A hands-on options curriculum covering real trading concepts. Read the lessons, work through examples, and test your knowledge.
OVERALL ACADEMY PROGRESS
Free Lesson
Every lesson is free to read. Subscribe to add Signal Desk, progress tracking, PDF downloads and the lesson tutor.
Key terms in this lesson
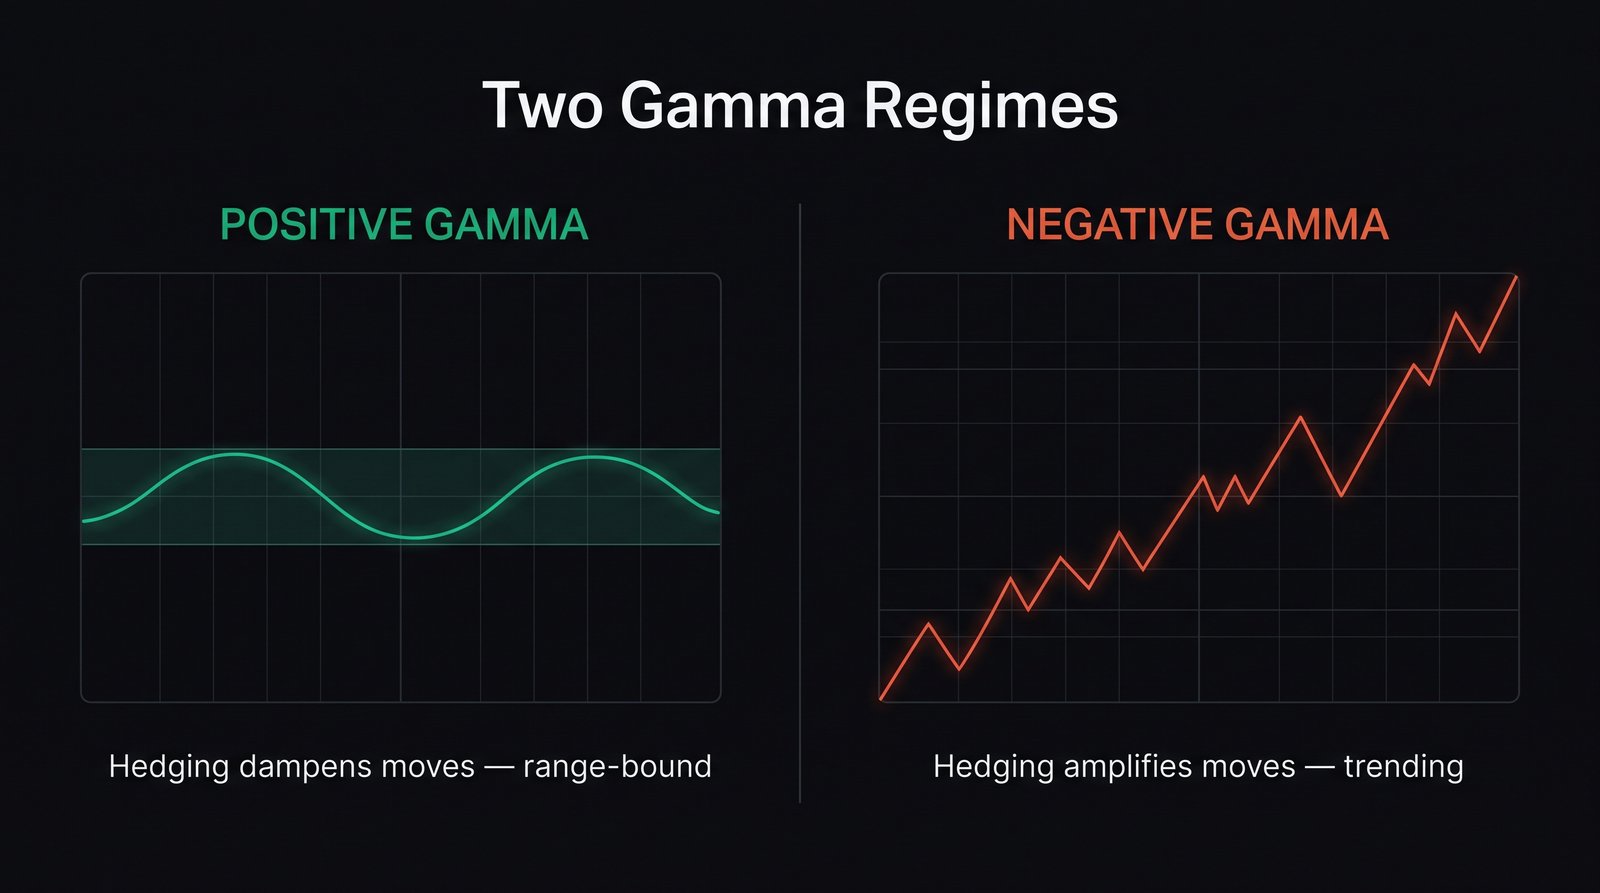 Click to enlarge
Lesson 5: 5.4: Market Maker Hedging & Gamma Exposure
How dealer hedging shapes intraday price behaviour, what positive and negative gamma regimes look like, and an honest view of how tradeable this really is.
1. Who Is on the Other Side
When you sell a put, someone bought it. That someone is usually not another retail trader — it is a market maker whose business is providing liquidity, not taking directional bets.
Market makers profit from the bid-ask spread. Every contract they trade creates directional exposure they did not want, so they immediately neutralize it by trading the underlying stock.
Worked example: You buy 10 call contracts at 0.40 delta. The market maker who sold them now holds −400 deltas. To return to neutral, they buy 400 shares of the stock.
★ Core Fact: Your options trade generates real stock buying or selling by the dealer on the other side. Options volume translates mechanically into underlying volume through hedging — which is the entire basis for everything in this lesson.
2. Why Hedging Must Be Continuous
A single hedge is not sufficient, because delta changes as the stock moves. That is gamma, from Lesson 2.0.
The dealer who bought 400 shares against short calls finds that if the stock rises, those calls gain delta — perhaps to 0.55 — meaning they are now short 550 deltas against only 400 shares. They must buy 150 more.
If the stock falls instead, delta drops to perhaps 0.28, leaving them over-hedged and needing to sell shares.
This continuous rebalancing is what makes dealer positioning matter to price action. It is not discretionary trading; it is mechanical risk management occurring at scale across the whole market.
★ Core Fact: The direction of that mechanical flow — whether dealers buy into strength or into weakness — depends entirely on whether their aggregate gamma position is positive or negative.
3. The Two Regimes
Positive gamma (dealers are net long options):
• Stock rises → dealer delta increases → they sell shares
• Stock falls → dealer delta decreases → they buy shares
• Effect: hedging flows lean against the move, dampening volatility
• Market character: range-bound, mean-reverting, moves that fade
Negative gamma (dealers are net short options):
• Stock rises → they must buy shares to stay hedged
• Stock falls → they must sell shares
• Effect: hedging flows amplify the move, accelerating volatility
• Market character: trending, sharp moves, air pockets, follow-through
This is the mechanism often cited to explain why some sessions grind quietly in a narrow range while others accelerate relentlessly in one direction.
★ Practical Framing: In positive gamma regimes, dip-buying and fading extremes tend to work. In negative gamma regimes, those approaches get run over, and momentum tends to persist.
4. Gamma Exposure (GEX) and the Flip Point
GEX is an attempt to estimate aggregate dealer gamma across all strikes for an index or stock, expressed as a single figure.
The commonly cited concept is the gamma flip level — the price at which aggregate dealer gamma crosses from positive to negative. Above it, hedging is theoretically stabilizing; below it, destabilizing.
Large open interest at particular strikes is also described as creating 'magnets,' where hedging flows around heavily traded strikes can hold price near them, particularly approaching monthly expiration.
⚠️ Important Caveat: GEX is an estimate built on assumptions, not observed data. Dealer positioning is not publicly disclosed. Published GEX figures infer it from open interest and assume which side of each contract dealers are on — an assumption that is frequently wrong. Treat these numbers as rough context, never as fact.
5. An Honest Assessment of Tradeability
This material is genuinely interesting and it explains real market behaviour. It is also, for almost every retail trader, not directly actionable — and that deserves saying plainly.
The reasons:
• The data is inferred, not disclosed. You are trading someone's model of dealer positioning, and models disagree with each other substantially.
• Positioning changes continuously as new options are traded, so a morning figure may be stale by the afternoon.
• Institutions with better data and faster execution act on this first.
• None of it produces a specific entry, stop, or position size — the things that actually determine trading outcomes.
★ Where it genuinely helps: As context rather than signal. Knowing that heavy option expiration can pin prices near large strikes, or that certain conditions produce sharper trend days, sets sensible expectations. If you sell premium, understanding that some environments produce persistent trends rather than mean reversion helps you anticipate when short strikes are more likely to be tested.
That is real value. It is simply a different kind of value than a tradeable signal, and courses that present GEX as a precise timing tool are overselling it.
6. Try It in Signal Desk
Signal Desk does not show dealer gamma exposure (GEX), so for the next two weeks note before the open whether any freely available GEX source describes the market as being in positive or negative gamma. Write it down.
At the close, record what actually happened: did the session grind in a range and fade extremes, or did it trend persistently in one direction? Signal Desk's Market tab gives you the day's picture, with SPY and QQQ conditions, breadth and the VIX deep dive.
After ten sessions, review your notes. You will develop a personal, evidence-based sense of how much predictive value this framework carries, which is far more useful than accepting either the enthusiastic or dismissive version on faith.
See it in Signal Desk
Signal Desk shows gamma for each option and the market backdrop, but not dealer positioning (members see live quotes).
- 1
Open Options, switch to the Easy Chain and tap a strike. The details list its gamma under "The Greeks". Compare a strike with a week to expiry and one with six weeks to see gamma rise as time runs out.
- 2
Open the Market tab and read the SPY and QQQ panel. It describes direction, the last few days, price swings and market fear in plain words.
- 3
Open the VIX deep dive from the Market tab. Its term structure and the gap between the VIX and realized volatility are a measure of stress, not of direction.
- 4
Keep your own log of what the market did each day next to what the GEX source said. That evidence is yours, and it is the honest test of the framework.
GEX Heatmap & Dealer Hedging Profile
The Gamma Exposure (GEX) profile dictates the hedging loops of market-makers. Slide the price pointer below to see how institutional hedging flows suppress volatility or trigger cascading market trends.
Price Controller
Gamma Transition Zone (Near $100): Resting near the Volatility Flip Line. Dealer hedging is transitioning, making the price range choppy as dealer flows oscillate. Expect choppy intraday price ranges.
KNOWLEDGE RECONNAISSANCE
Why must options market makers constantly trade the underlying stock?
How do dealer hedging flows behave in a negative gamma regime?
You buy 10 call contracts at 0.40 delta. What does the dealer on the other side likely do?
In a positive gamma regime, what market character typically results?
What is the most important caveat about published GEX figures?
What is the realistic value of gamma exposure analysis for a retail options trader?
More lessons in this module
- 5.0: Vertical Spread Architectures
- 5.1: Iron Condors & Butterfly Spreads
- 5.2: Volatility Crush & Earnings Strategies
- 5.3: Portfolio Risk & Beta-Weighted Delta
Signal Desk is where you practice this on real stocks: real option chains (about 15 minutes delayed), the Trade Check and a paper-trading account that risks no real money. Join to add it, your progress tracking and PDF downloads.