
A hands-on options curriculum covering real trading concepts. Read the lessons, work through examples, and test your knowledge.
OVERALL ACADEMY PROGRESS
Free Lesson
Every lesson is free to read. Subscribe to add Signal Desk, progress tracking, PDF downloads and the lesson tutor.
Key terms in this lesson
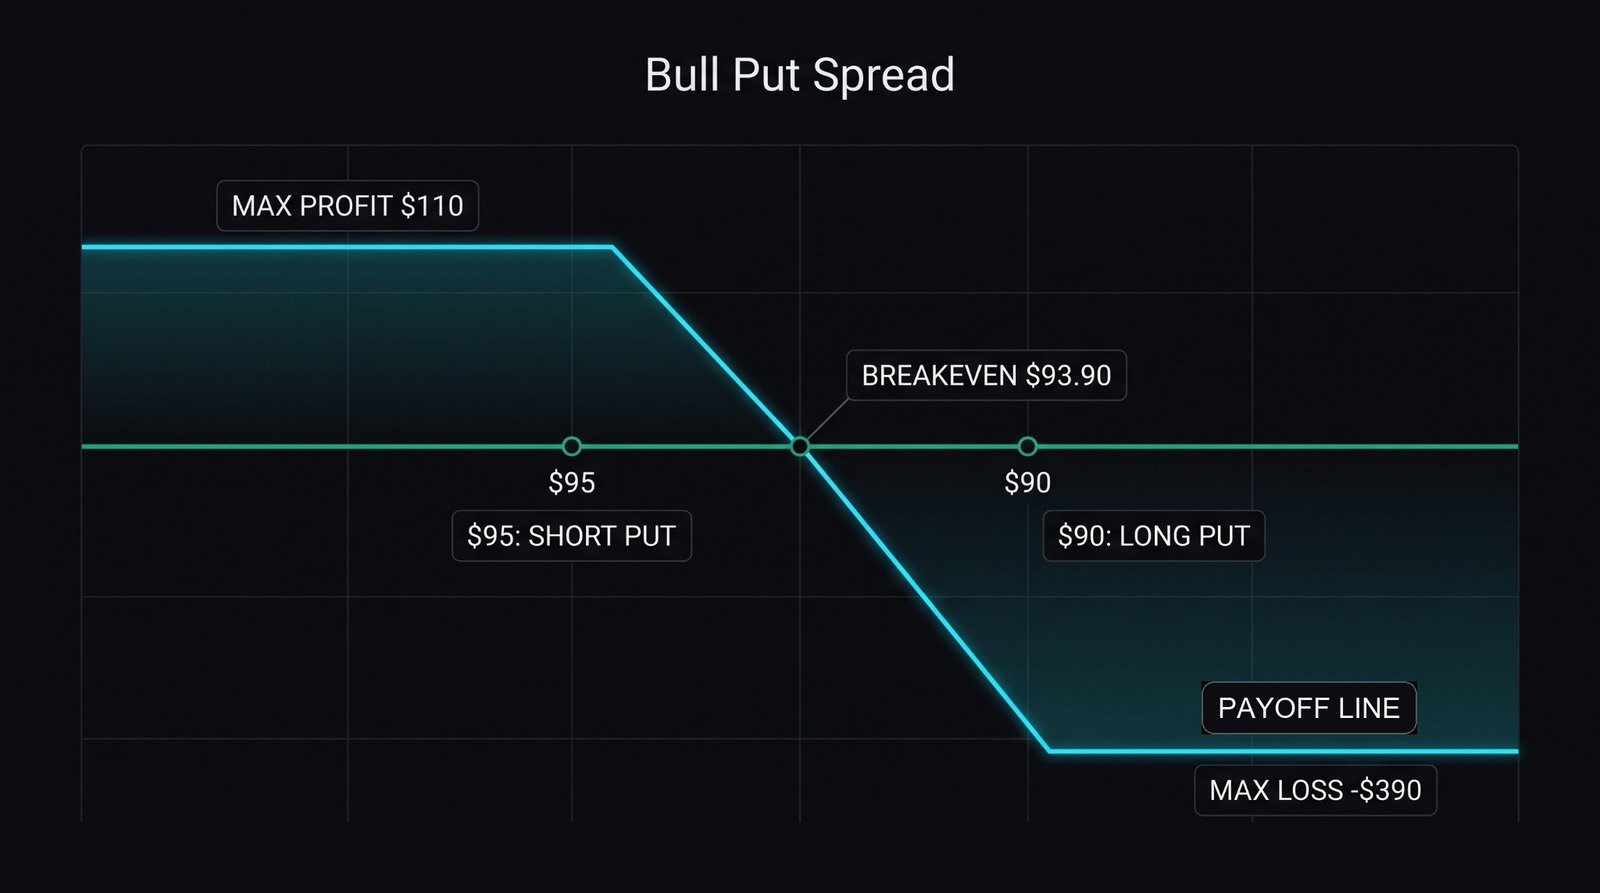 Click to enlarge
Lesson 1: 5.0: Vertical Spread Architectures
Defined-risk directional trades — the four verticals, complete P&L math, and why they solve the capital problem that limits the Wheel.
1. What a Vertical Spread Solves
A vertical spread means buying one option and selling another of the same type and expiration, at different strikes. The name comes from the strikes sitting vertically above one another on an option chain.
It exists to solve two problems you have already encountered in this course.
• The capital problem: A cash-secured put on a $95 stock ties up $9,500. A put spread with the same directional view might tie up $350. On a modest account, this is the difference between one position and a diversified book.
• The unlimited-risk problem: Selling a naked put or call exposes you to very large losses. Buying a further strike as protection caps that loss at a known figure before you enter.
★ Core Fact: Every vertical spread has a defined maximum profit and a defined maximum loss, both computable before you place the order. You never need to wonder what the worst case is.
2. The Four Verticals
Two directions, two ways to construct each. All four use the same underlying and expiration.
Credit spreads (you collect premium, you want the stock to stay away):
• Bull Put Spread: Sell a higher-strike put, buy a lower-strike put. Profits if the stock stays up.
• Bear Call Spread: Sell a lower-strike call, buy a higher-strike call. Profits if the stock stays down.
Debit spreads (you pay premium, you need movement):
• Bull Call Spread: Buy a lower-strike call, sell a higher-strike call. Profits if the stock rises.
• Bear Put Spread: Buy a higher-strike put, sell a lower-strike put. Profits if the stock falls.
★ Practical Guidance: Credit spreads suit high IV Rank environments, where premium is rich and you benefit from decay. Debit spreads suit low IV Rank, where options are cheap and you need directional movement to pay off. This is the volatility filter from Lesson 2.2 applied directly.
3. Bull Put Spread — Full Math
This is the defined-risk cousin of the cash-secured put, and it is the workhorse for smaller accounts.
Stock XYZ at $100, IV Rank 55. You are neutral to bullish over the next 40 days.
• Sell the $95 put for $2.00 (collect $200)
• Buy the $90 put for $0.90 (pay $90)
• Net credit: $1.10, or $110 per spread
The complete numbers:
• Maximum profit: $110 — realized if the stock stays above $95 and both expire worthless
• Strike width: $95 − $90 = $5.00, or $500
• Maximum loss: $500 − $110 = $390 — realized if the stock falls below $90
• Breakeven: $95 − $1.10 = $93.90
• Capital required: $390 (the maximum loss)
• Return on capital if maximum profit: $110 ÷ $390 = 28.2% over 40 days
★ Compare to the cash-secured put: The $95 cash-secured put ties up $9,500 to earn $200. This spread ties up $390 to earn $110. The spread earns less in dollars but roughly 13 times more per dollar of capital committed — and your worst case is capped at $390 rather than a potential multi-thousand-dollar assignment loss.
 Click to enlarge
4. Bull Call Spread — Full Math
The debit version, used when you want directional exposure but find outright calls too expensive.
Stock XYZ at $100, IV Rank 22 — options are cheap. You are bullish over 45 days.
• Buy the $100 call for $3.50 (pay $350)
• Sell the $105 call for $1.50 (collect $150)
• Net debit: $2.00, or $200 per spread
The complete numbers:
• Maximum loss: $200 — the debit paid, realized if the stock stays below $100
• Maximum profit: $500 − $200 = $300 — realized if the stock closes above $105
• Breakeven: $100 + $2.00 = $102.00
• Return on capital if maximum profit: $300 ÷ $200 = 150%
Compare to buying the $100 call outright at $350. That has unlimited upside but needs the stock above $103.50 to break even. The spread breaks even at $102.00 and costs $150 less — you sacrificed the tail above $105 to reduce cost and lower the bar.
★ Core Fact: Selling the further strike caps your upside but funds a meaningful part of the position. Most directional moves do not extend far beyond a reasonable target, which is why spreads often outperform outright long options in practice.
5. Managing Spreads
The management rules mirror what you learned for single-leg premium selling, with one addition.
For credit spreads:
• Close at 50% of maximum profit. On the $110 credit spread above, buy it back at $0.55 and bank $55.
• Close at 21 days to expiration regardless, to avoid the gamma zone.
• If the short strike is breached, roll for a credit or close. Do not hold to expiration hoping for recovery.
The addition — assignment on the short leg: If your short put is assigned early, you buy 100 shares while still holding the long put as protection. This is manageable, not catastrophic, but it consumes capital unexpectedly. Exercising your long put closes the whole thing out at roughly the maximum loss.
⚠️ Risk Warning: Both legs must be closed. Traders sometimes close the profitable long leg and leave the short leg open, converting a defined-risk spread into a naked position. Always close spreads as a single multi-leg order, per Lesson 3.0.
6. Try It in Signal Desk
Pick a stock and look at the Market tab's HV Rank for it. If it is high, build a bull put spread: sell the put near 0.25 delta and buy the strike $5 below, 30 to 45 days out. If volatility is low, build a bull call spread instead.
Read all six numbers from the panel: the net credit or debit, the maximum profit, the maximum loss, the breakeven, the capital required and the return on capital.
Then build the equivalent cash-secured put or outright long call and put the two side by side. The capital efficiency difference is usually the moment spreads stop feeling complicated and start feeling necessary.
See it in Signal Desk
Signal Desk builds all four vertical spreads and shows their maximum profit, maximum loss and breakeven (members see live quotes).
- 1
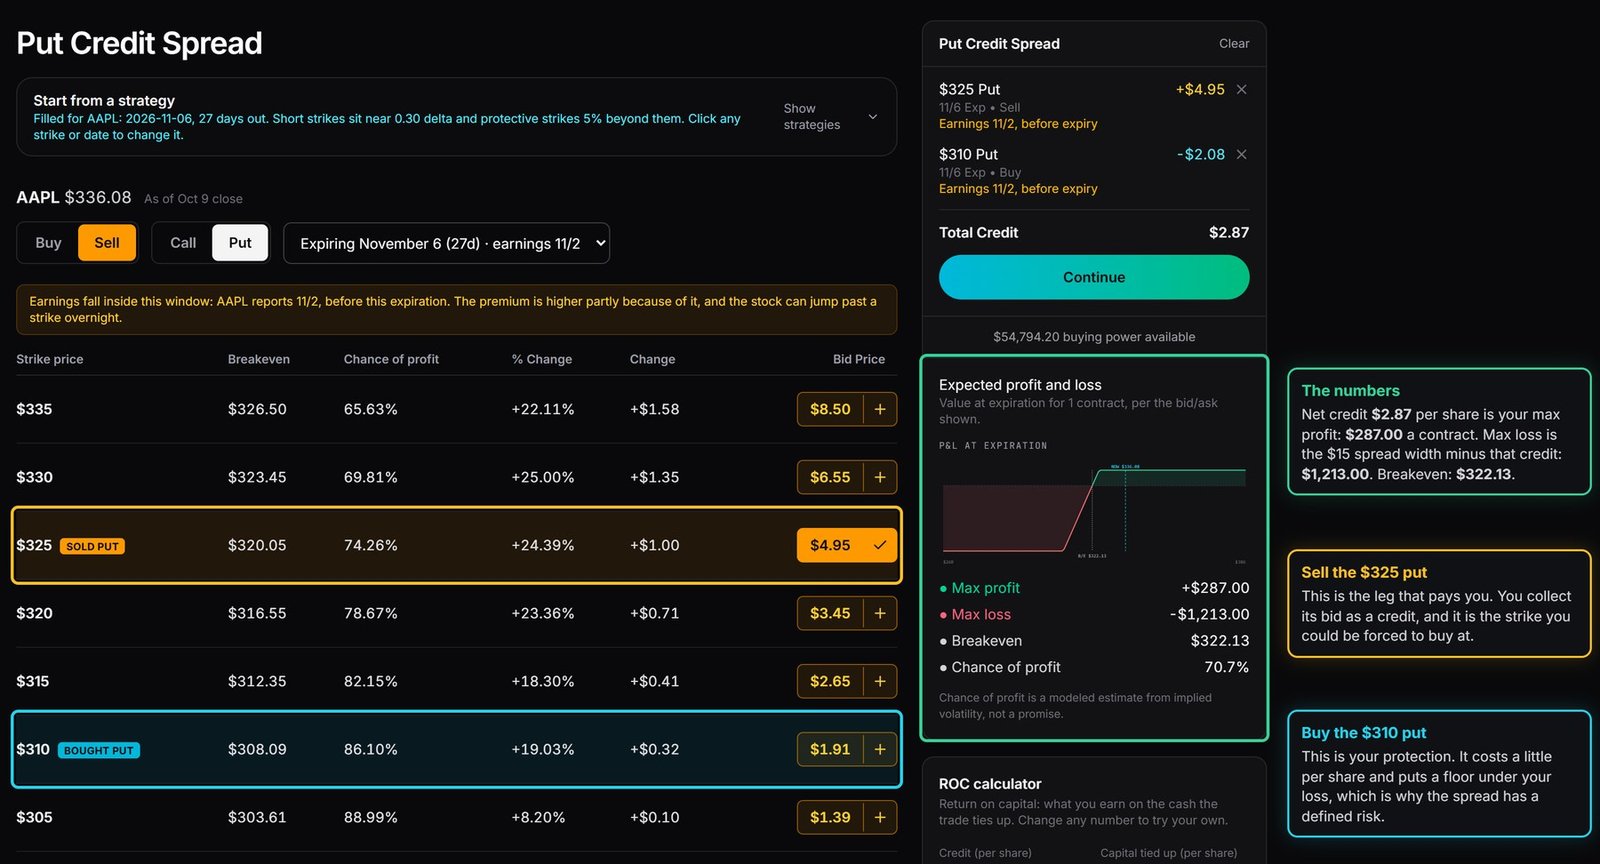
Open Options and either pick a spread from "Auto-fill a strategy" on the chain, or use the Easy Chain, which handles two-leg spreads on one expiration.
- 2
For a bull put spread, sell the higher put and buy the lower put on the same date. The panel shows the net credit, the maximum profit, the maximum loss and the breakeven.
- 3
The payoff table shows the possible profit or loss at each price and date, so you can see the defined-risk shape the lesson describes.
- 4
Then build the single cash-secured put at the same short strike and compare how much cash each one ties up.
- 5
Send either to Paper Trading and watch how it behaves as expiration approaches.
Try it with your own numbers
Free calculators, no account needed.
Credit Spread Curve Simulator
Credit spreads drastically reduce required collateral. Play with the simulation strikes below to analyze how strike price width defines your max risk and margins.
Spread Input Engine
KNOWLEDGE RECONNAISSANCE
You sell a $95 put for $2.00 and buy a $90 put for $0.90. What is your maximum loss?
Using that same spread, what is the breakeven price at expiration?
Which spread type is best suited to a high IV Rank environment?
A bull put spread ties up $390 versus $9,500 for the equivalent cash-secured put. What is the main trade-off?
Why is closing only one leg of a spread dangerous?
You buy a $100 call for $3.50 and sell a $105 call for $1.50. What is your maximum profit?
More lessons in this module
- 5.1: Iron Condors & Butterfly Spreads
- 5.2: Volatility Crush & Earnings Strategies
- 5.3: Portfolio Risk & Beta-Weighted Delta
- 5.4: Market Maker Hedging & Gamma Exposure
Signal Desk is where you practice this on real stocks: real option chains (about 15 minutes delayed), the Trade Check and a paper-trading account that risks no real money. Join to add it, your progress tracking and PDF downloads.