
A hands-on options curriculum covering real trading concepts. Read the lessons, work through examples, and test your knowledge.
OVERALL ACADEMY PROGRESS
Free Lesson
Every lesson is free to read. Subscribe to add Signal Desk, progress tracking, PDF downloads and the lesson tutor.
Key terms in this lesson
 Click to enlarge
Lesson 2: 5.1: Iron Condors & Butterfly Spreads
Non-directional structures for range-bound markets, with full construction math and the management rules that keep the rare losses survivable.
1. Trading a Range Instead of a Direction
Everything so far has required a directional view, even a mild one. Iron condors and butterflies do not. They profit when the stock stays within a range.
This makes them attractive for two reasons. Most stocks spend most of their time not trending, and having a non-directional strategy means you can deploy capital when you have no strong opinion.
★ Core Fact: A non-directional strategy is not a risk-free strategy. You are trading the view that realized movement will be smaller than the market currently expects. That is a genuine opinion about volatility, and it can be wrong.
2. Iron Condor Construction
An iron condor combines a bull put spread and a bear call spread on the same underlying and expiration. Four legs, all out of the money.
Stock XYZ at $100, IV Rank 60, 40 days to expiration:
• Sell the $95 put for $1.80, buy the $90 put for $0.80 → put spread credit $1.00
• Sell the $105 call for $1.60, buy the $110 call for $0.70 → call spread credit $0.90
• Total net credit: $1.90, or $190 per condor
The complete numbers:
• Maximum profit: $190 — realized if the stock finishes between $95 and $105
• Widest strike width: $5.00 ($500)
• Maximum loss: $500 − $190 = $310
• Breakevens: $95 − $1.90 = $93.10 on the downside, $105 + $1.90 = $106.90 on the upside
• Capital required: $310
• Return on capital at maximum profit: $190 ÷ $310 = 61.3% over 40 days
★ Core Fact: Only one side can lose. The stock cannot finish below $90 and above $110 simultaneously, which is why margin is charged on one spread rather than both.
 Click to enlarge
3. Where the Risk Actually Sits
The condor above wins if XYZ finishes anywhere between $93.10 and $106.90 — a roughly 13.8% wide window. That feels comfortable, and the win rate is genuinely high.
The arithmetic problem is the ratio. You risk $310 to make $190. A single maximum loss erases roughly 1.6 winning trades.
Worked illustration over ten trades at a realistic 75% win rate:
• 7 full winners: 7 × $190 = $1,330
• 1 partial winner closed early: +$60
• 2 maximum losses: 2 × −$310 = −$620
• Net: $770 across ten positions
Profitable, but note how thin the margin becomes if the loss rate rises even modestly. If one of those winners had been a loss instead, so that three trades lose rather than two, the result drops to $270. With four losses it turns into a $230 loss.
⚠️ Risk Warning: High win rate strategies fail when traders size them as though losses cannot happen. The condor's comfortable range invites overconfidence precisely because most trades work.
4. Butterfly Spreads
A butterfly is a tighter, cheaper structure that pays substantially more if the stock lands precisely at a target.
Construction using calls, stock at $100:
• Buy 1 × $95 call for $6.50
• Sell 2 × $100 calls for $3.50 each (collect $7.00)
• Buy 1 × $105 call for $1.60
• Net debit: $6.50 − $7.00 + $1.60 = $1.10, or $110
The complete numbers:
• Maximum loss: $110 — the debit paid, if the stock finishes outside $95 to $105
• Maximum profit: $500 − $110 = $390 — only if the stock finishes exactly at $100
• Breakevens: $96.10 and $103.90
• Return on capital at maximum profit: 354%
The trade-off against the condor is stark. The butterfly pays roughly 3.5 times more relative to capital, but the profit peak is a single point rather than a broad range, and full profit is rarely realized.
★ Practical Guidance: Butterflies are best used when you have a specific price target and a defined event or timeframe in mind. As a general income strategy, the condor's wider profit zone is far more forgiving.
5. Management Rules
Non-directional structures require discipline precisely because they usually work.
• Entry: IV Rank above 50. These are net premium-selling strategies and need rich premium to be worth the risk. (In Signal Desk, check the HV Rank and Trade Check's IV-versus-realized line, since a full IV Rank is not shown yet.)
• Strike placement: Short strikes around 0.16 delta each, implying roughly 84% probability each side expires worthless.
• Days to expiration: 30 to 45 at entry.
• Profit target: Close at 50% of maximum credit. On a $190 condor, buy back at $0.95 and bank $95.
• Time stop: Close at 21 days regardless of P&L.
• Breach rule: If the stock reaches a short strike, close or roll the threatened side. Do not wait for reversal.
★ Core Fact: Closing at 50% roughly halves the time in the trade while capturing half the premium. Because the final portion of decay comes packaged with the highest gamma risk, the risk-adjusted return of exiting early is typically superior to holding for the full credit.
6. Try It in Signal Desk
Find a liquid, large stock with a high HV Rank on the Market tab. Open the Options page, choose Iron condor from "Auto-fill a strategy", and look at how the four legs are placed: short strikes near 0.16 delta on each side and long strikes $5 beyond each, 30 to 45 days out.
Read all six numbers from the panel: the net credit, the maximum profit, the maximum loss, both breakevens and the return on capital.
Then calculate how many maximum losses it takes to erase your accumulated profit at a 75% win rate. That single number is the most useful thing to know before deploying this structure, and it is the one most traders never compute. Signal Desk builds the iron condor; the butterfly in Section 4 you would build by hand.
See it in Signal Desk
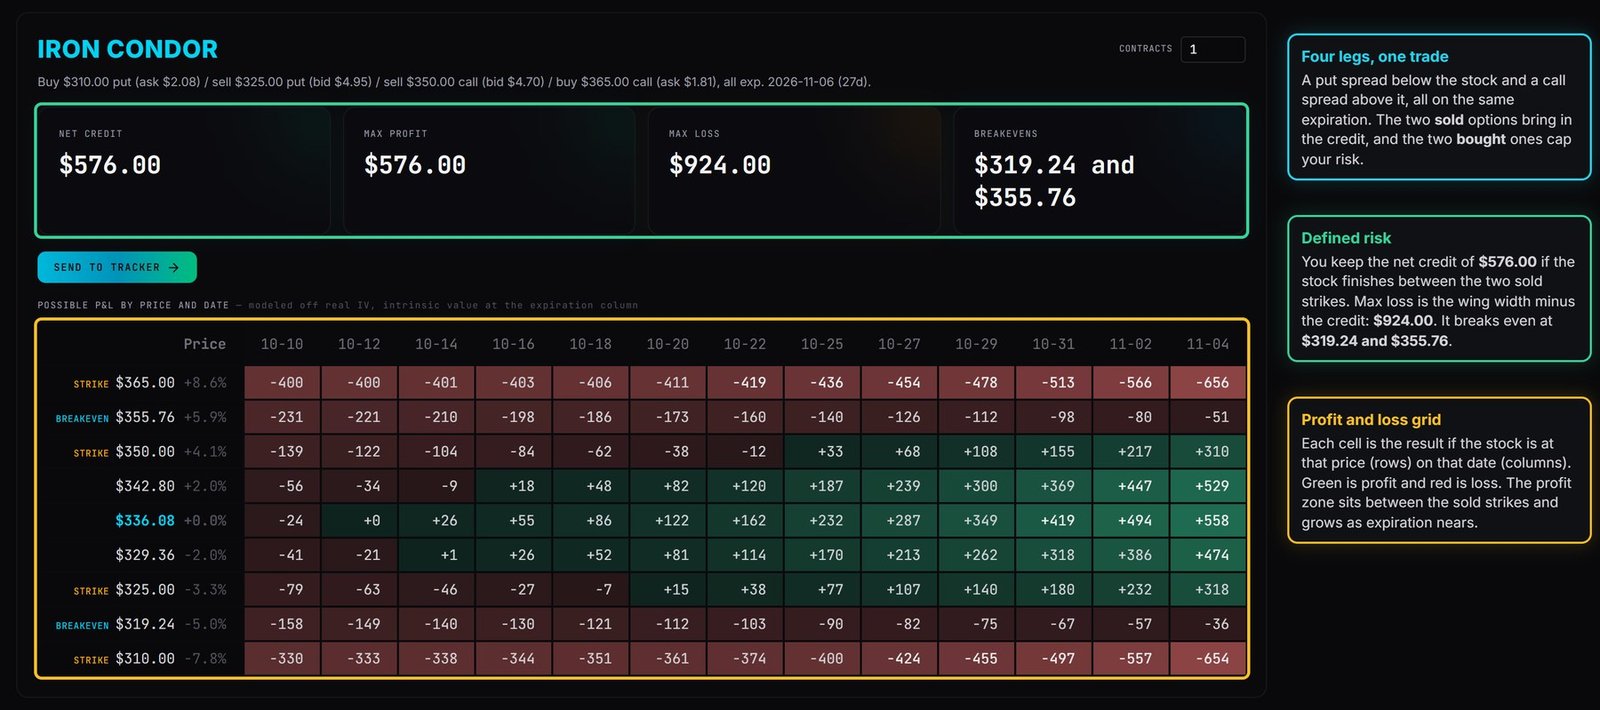
Signal Desk builds an iron condor in one click and draws its profit and loss grid (members see live quotes).
- 1
Open Options and, under "Calls and puts together", choose Iron condor. The chain fills in a date and four strikes for you.
- 2
The panel shows the net credit, the maximum profit, the maximum loss and the two breakevens, one on each side of the stock.
- 3
The grid shows the profit or loss at each price and date. Notice the flat top where the condor earns its maximum if the stock stays between the short strikes.
- 4
Change a strike or the date and watch the numbers move. Widening the spread raises the maximum loss; moving the short strikes closer to the price raises the credit and the risk of being tested.
- 5
Open the Trade Check to see where the short strikes sit relative to the stock's recent range and any earnings date.
Iron Condor & Butterfly Builder
Multi-leg spread strategies let you engineer highly customized return profiles. Use the builder below to toggle between an Iron Condor and a Butterfly Spread, adjust the parameters, and analyze the payoff curve.
Leg Configurations
KNOWLEDGE RECONNAISSANCE
An iron condor is constructed from which two components?
You collect a $1.90 credit on a condor with $5-wide strikes. What is your maximum loss?
Under what market conditions does an iron condor perform best?
What is the body structure of a standard long butterfly spread?
Why is closing an iron condor at 50% of maximum profit often superior to holding to expiration?
A condor risks $310 to make $190 with a 75% win rate. What is the key danger?
More lessons in this module
- 5.0: Vertical Spread Architectures
- 5.2: Volatility Crush & Earnings Strategies
- 5.3: Portfolio Risk & Beta-Weighted Delta
- 5.4: Market Maker Hedging & Gamma Exposure
Signal Desk is where you practice this on real stocks: real option chains (about 15 minutes delayed), the Trade Check and a paper-trading account that risks no real money. Join to add it, your progress tracking and PDF downloads.