
A hands-on options curriculum covering real trading concepts. Read the lessons, work through examples, and test your knowledge.
OVERALL ACADEMY PROGRESS
Free Lesson
Every lesson is free to read. Subscribe to add Signal Desk, progress tracking, PDF downloads and the lesson tutor.
Lesson 6: 11.6: Composite Profiles
Master multi-day, multi-week volume aggregation to identify macro institutional levels.
1. What is a Composite Profile?
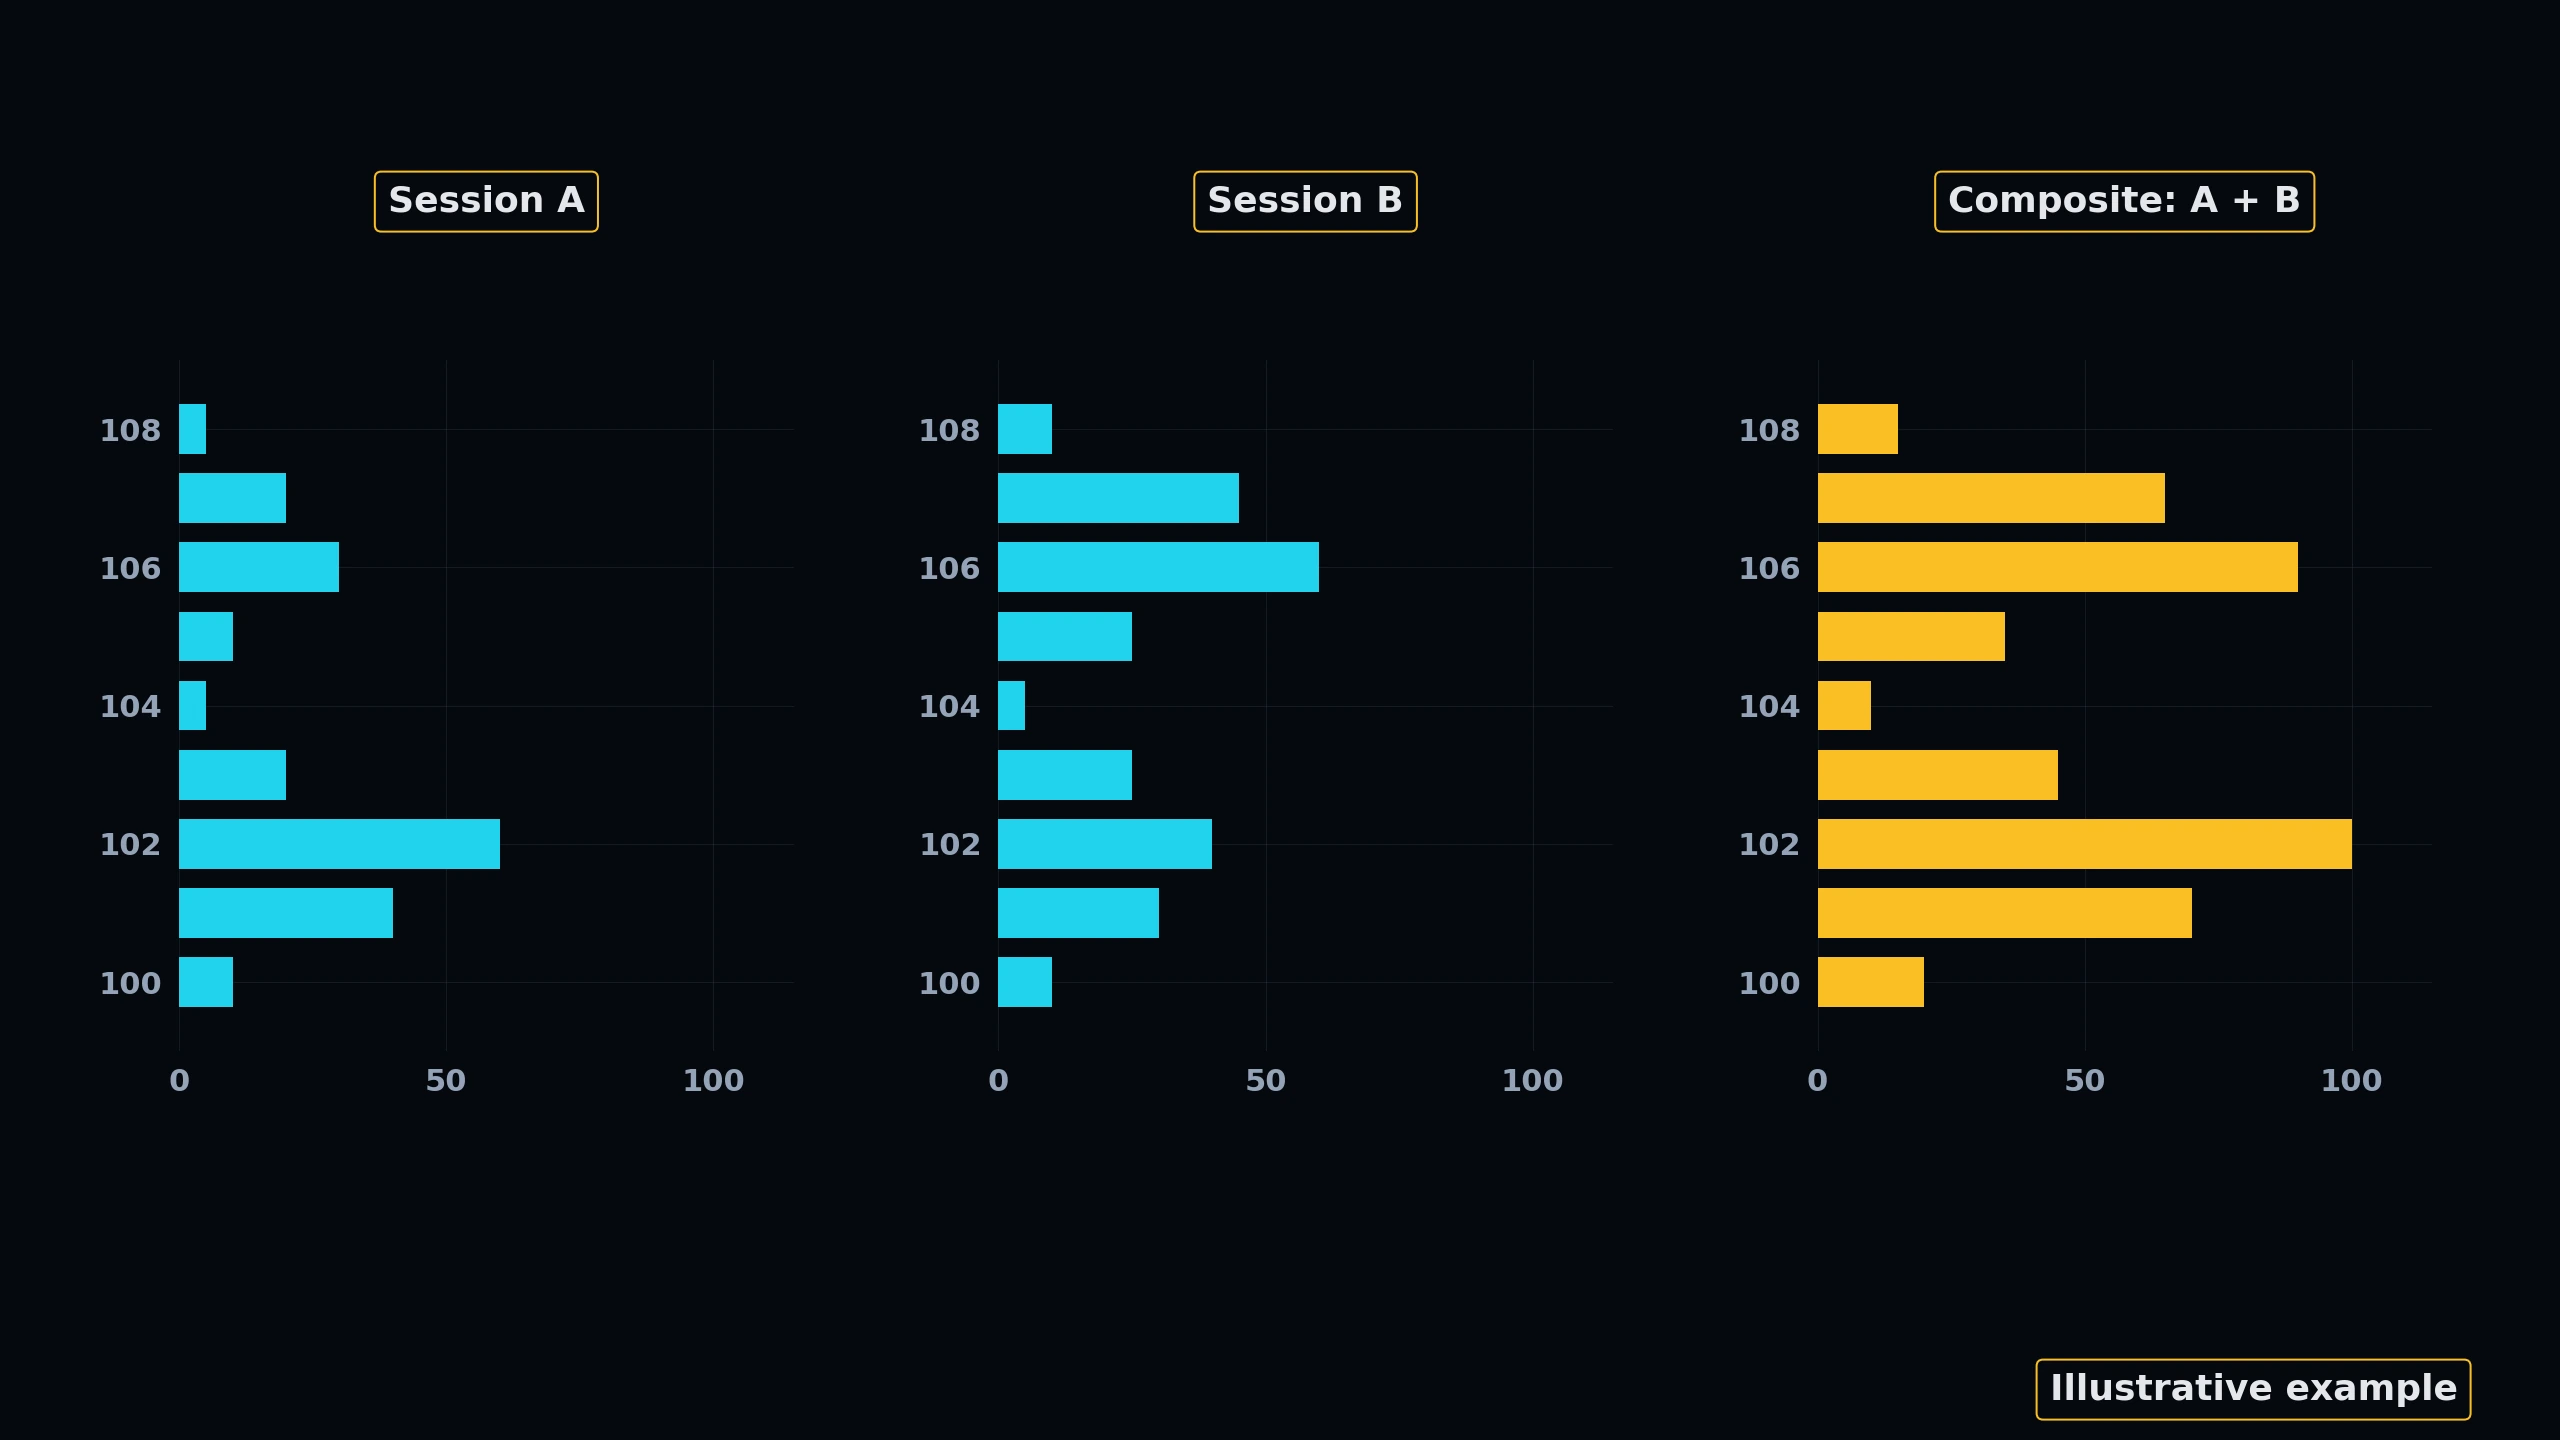
While a Session Profile focuses on a single day, a Composite Profile aggregates volume-at-price data across a broad, multi-day, monthly, or yearly timeframe.
This high-level view reveals the macro-structural landscape of an asset. It exposes the primary areas of long-term consolidation and major multi-year support/resistance nodes.
★ Institutional Anchor: Composite profiles smooth out short-term noise, showing you where the largest long-term investors are accumulation assets.
2. Analyzing Multi-Distribution Profiles
A composite profile often displays several distinct peaks and valleys, known as a multi-distribution profile:
• Double-Distribution: Features two primary HVNs separated by an LVN. Price will often spend weeks in one distribution before breaking through the LVN to range in the other.
• Balanced Profile: A single large, symmetric normal distribution showing long-term market agreement.
 Click to enlarge
Interactive Volume Profile Canvas
Volume profile plots the cumulative volume traded at specific price levels, revealing the Point of Control (POC - price of highest volume) and the Value Area (where 70% of transactions occur).
Profile Controls
KNOWLEDGE RECONNAISSANCE
What does a double-distribution Composite Profile suggest about market structure?
More lessons in this module
- 11.0: Introduction to Volume Profile
- 11.1: Building a Volume Profile
- 11.2: Point of Control (POC)
- 11.3: The Value Area (VAH & VAL)
- 11.4: High Volume Nodes (HVN)
- 11.5: Low Volume Nodes (LVN)
- 11.7: Volume Profile Strategies
- 11.8: Practical Application: Profile Playbook
Signal Desk is where you practice this on real stocks: real option chains (about 15 minutes delayed), the Trade Check and a paper-trading account that risks no real money. Join to add it, your progress tracking and PDF downloads.