
A hands-on options curriculum covering real trading concepts. Read the lessons, work through examples, and test your knowledge.
OVERALL ACADEMY PROGRESS
Free Lesson
Every lesson is free to read. Subscribe to add Signal Desk, progress tracking, PDF downloads and the lesson tutor.
Key terms in this lesson
Lesson 3: 11.3: The Value Area (VAH & VAL)
Understand the range where the majority of trading volume takes place.
1. Defining the Value Area
The Value Area (VA) is the price range on a volume profile where a specified percentage of total volume was executed. By convention, this is set to 70% (derived from the first standard deviation of a normal bell curve distribution).
This range defines where the market established a clear consensus of value during the session. Prices within the Value Area are considered 'fair', while prices outside are considered 'unfair'.
★ Boundary Markers: The Value Area High (VAH) is the upper boundary of this range, and the Value Area Low (VAL) is the lower boundary.
2. Inside vs. Outside Value Dynamics
• Inside Value Area: Price is in a state of balance. Trading is dominated by responsive players who fade the edges (buying VAL, selling VAH) expecting price to return to the POC.
• Outside Value Area: Price is in a state of imbalance. If price moves outside VAH or VAL and establishes acceptance (time and volume), it signals that initiative buyers or sellers are driving a breakout trend toward a new value region.
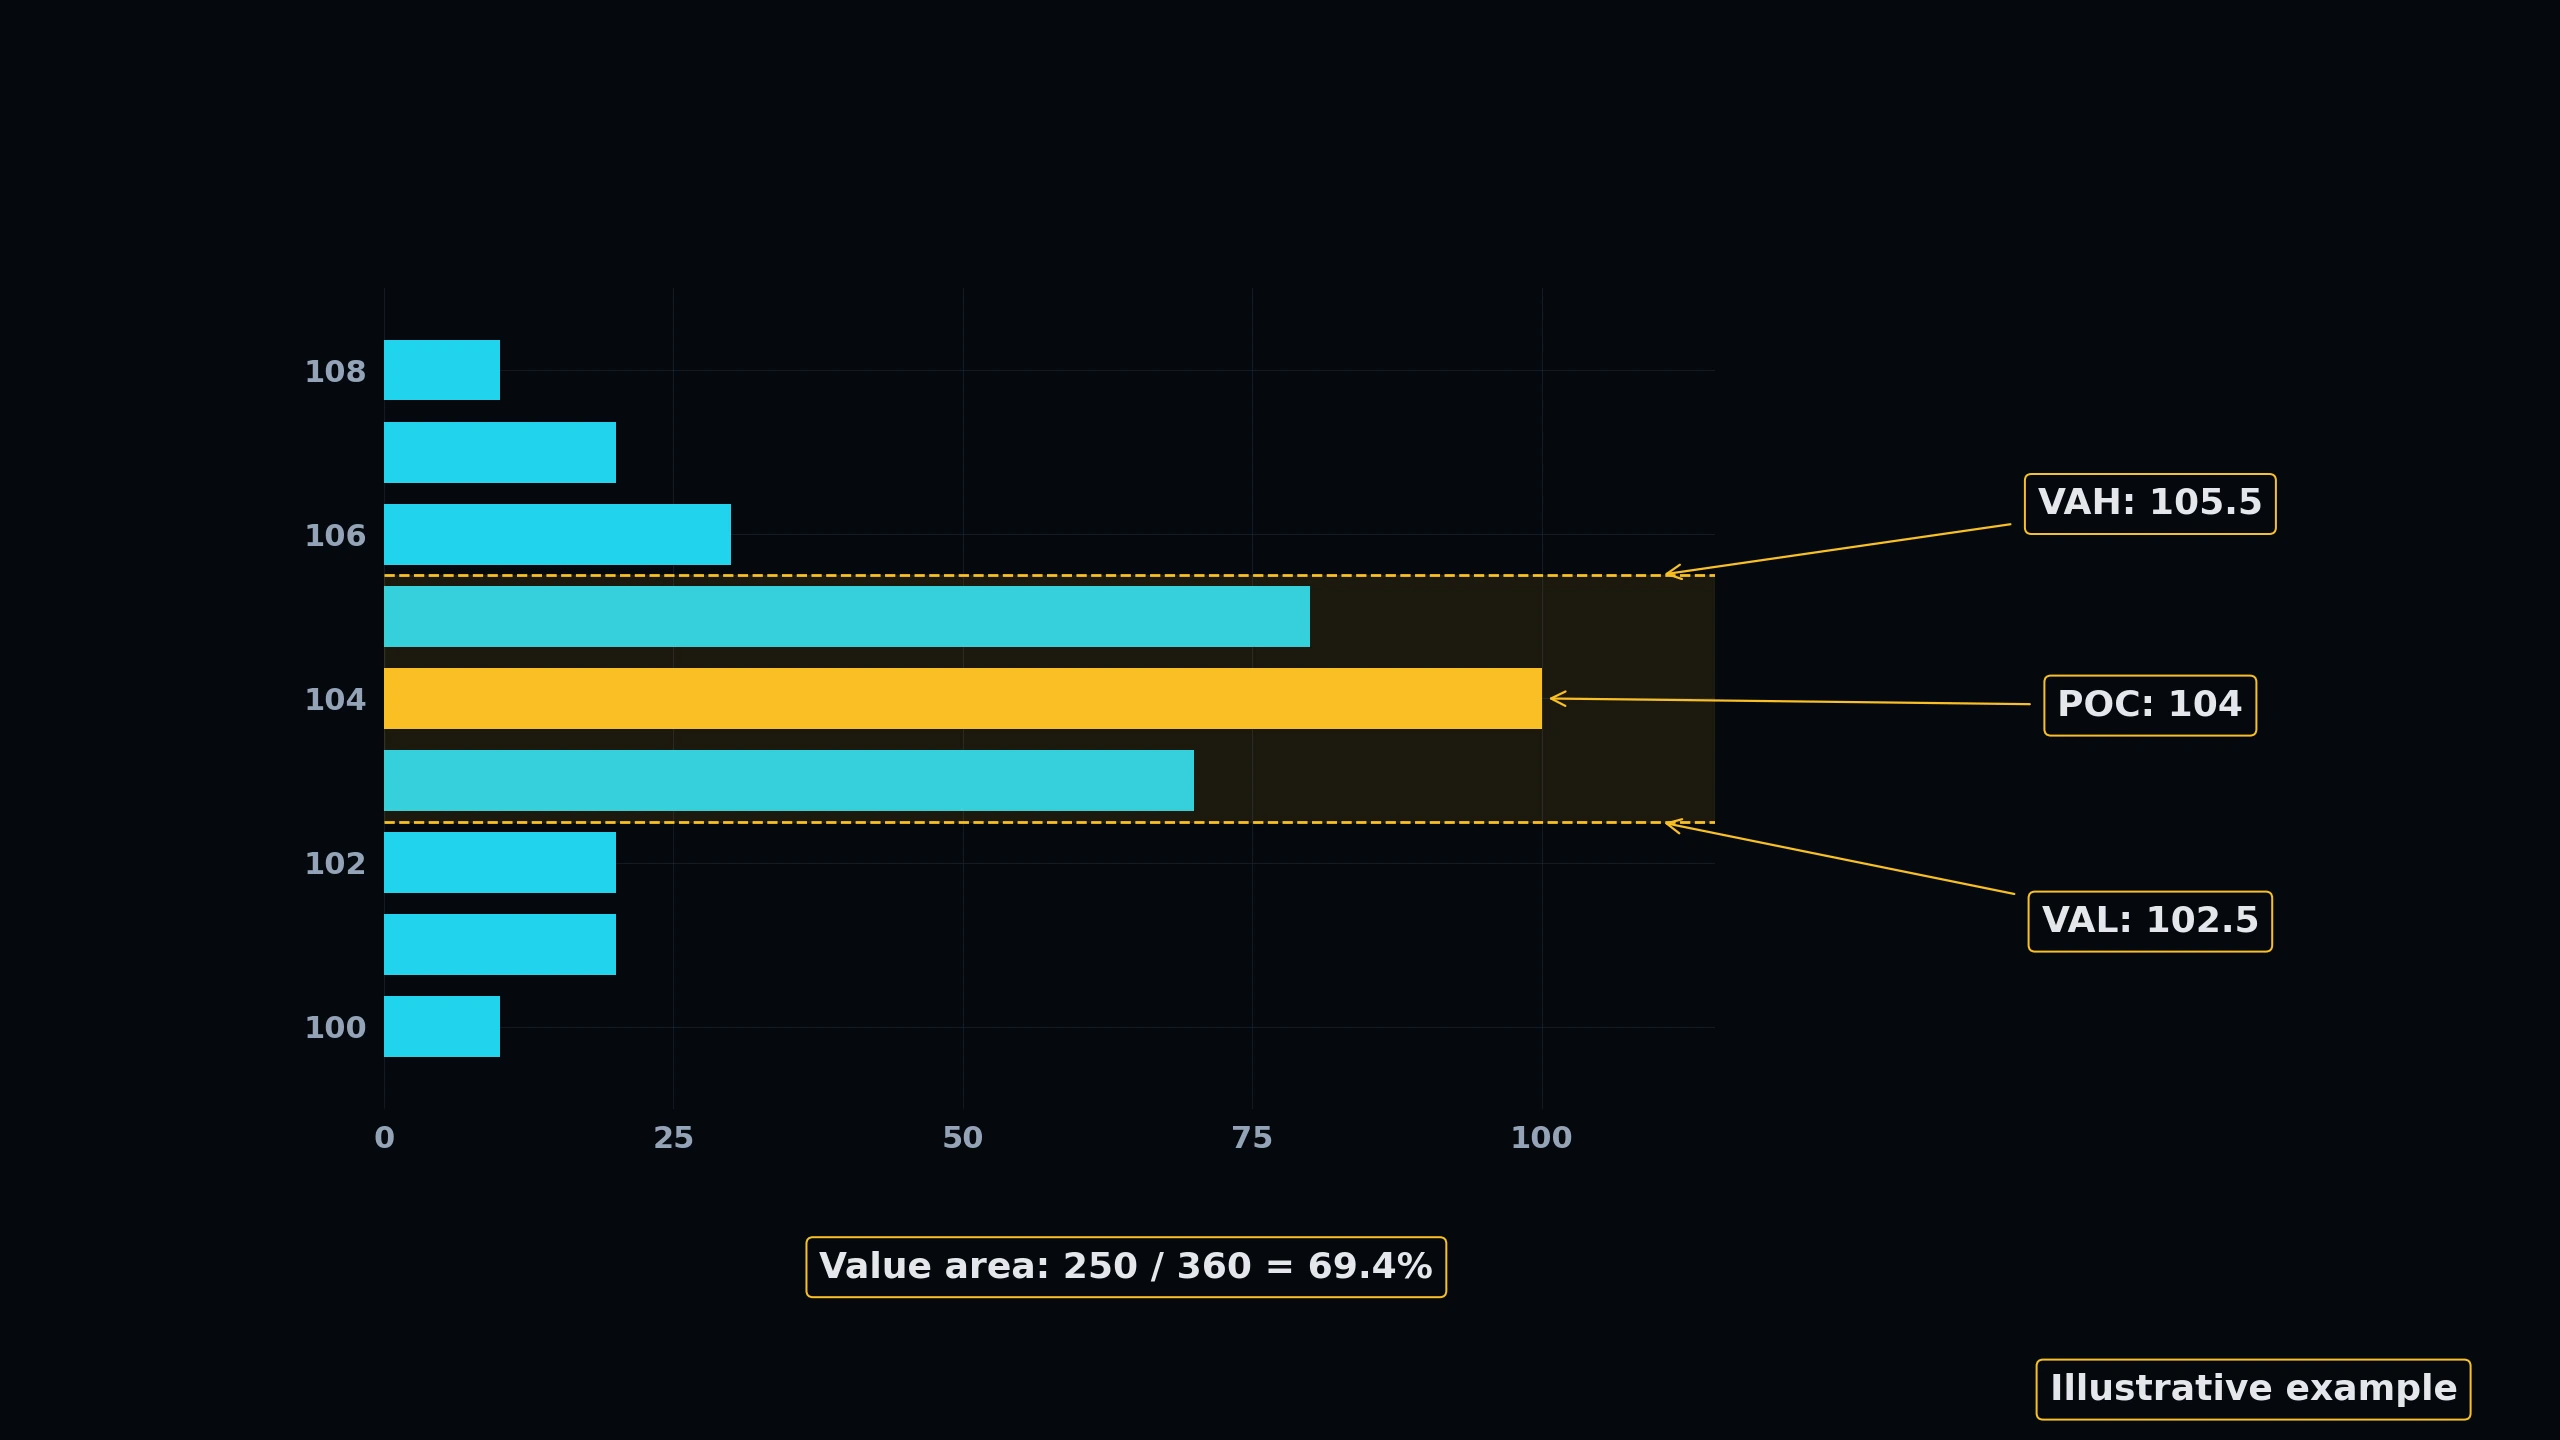 Click to enlarge
Interactive Volume Profile Canvas
Volume profile plots the cumulative volume traded at specific price levels, revealing the Point of Control (POC - price of highest volume) and the Value Area (where 70% of transactions occur).
Profile Controls
KNOWLEDGE RECONNAISSANCE
What percentage of total trading volume is conventionally contained within the Value Area?
More lessons in this module
- 11.0: Introduction to Volume Profile
- 11.1: Building a Volume Profile
- 11.2: Point of Control (POC)
- 11.4: High Volume Nodes (HVN)
- 11.5: Low Volume Nodes (LVN)
- 11.6: Composite Profiles
- 11.7: Volume Profile Strategies
- 11.8: Practical Application: Profile Playbook
Signal Desk is where you practice this on real stocks: real option chains (about 15 minutes delayed), the Trade Check and a paper-trading account that risks no real money. Join to add it, your progress tracking and PDF downloads.