
A hands-on options curriculum covering real trading concepts. Read the lessons, work through examples, and test your knowledge.
OVERALL ACADEMY PROGRESS
Free Lesson
Every lesson is free to read. Subscribe to add Signal Desk, progress tracking, PDF downloads and the lesson tutor.
Lesson 0: 11.0: Introduction to Volume Profile
Understand the foundational concept of horizontal volume analysis and how it differs from traditional volume-at-time.
1. What is Volume Profile?
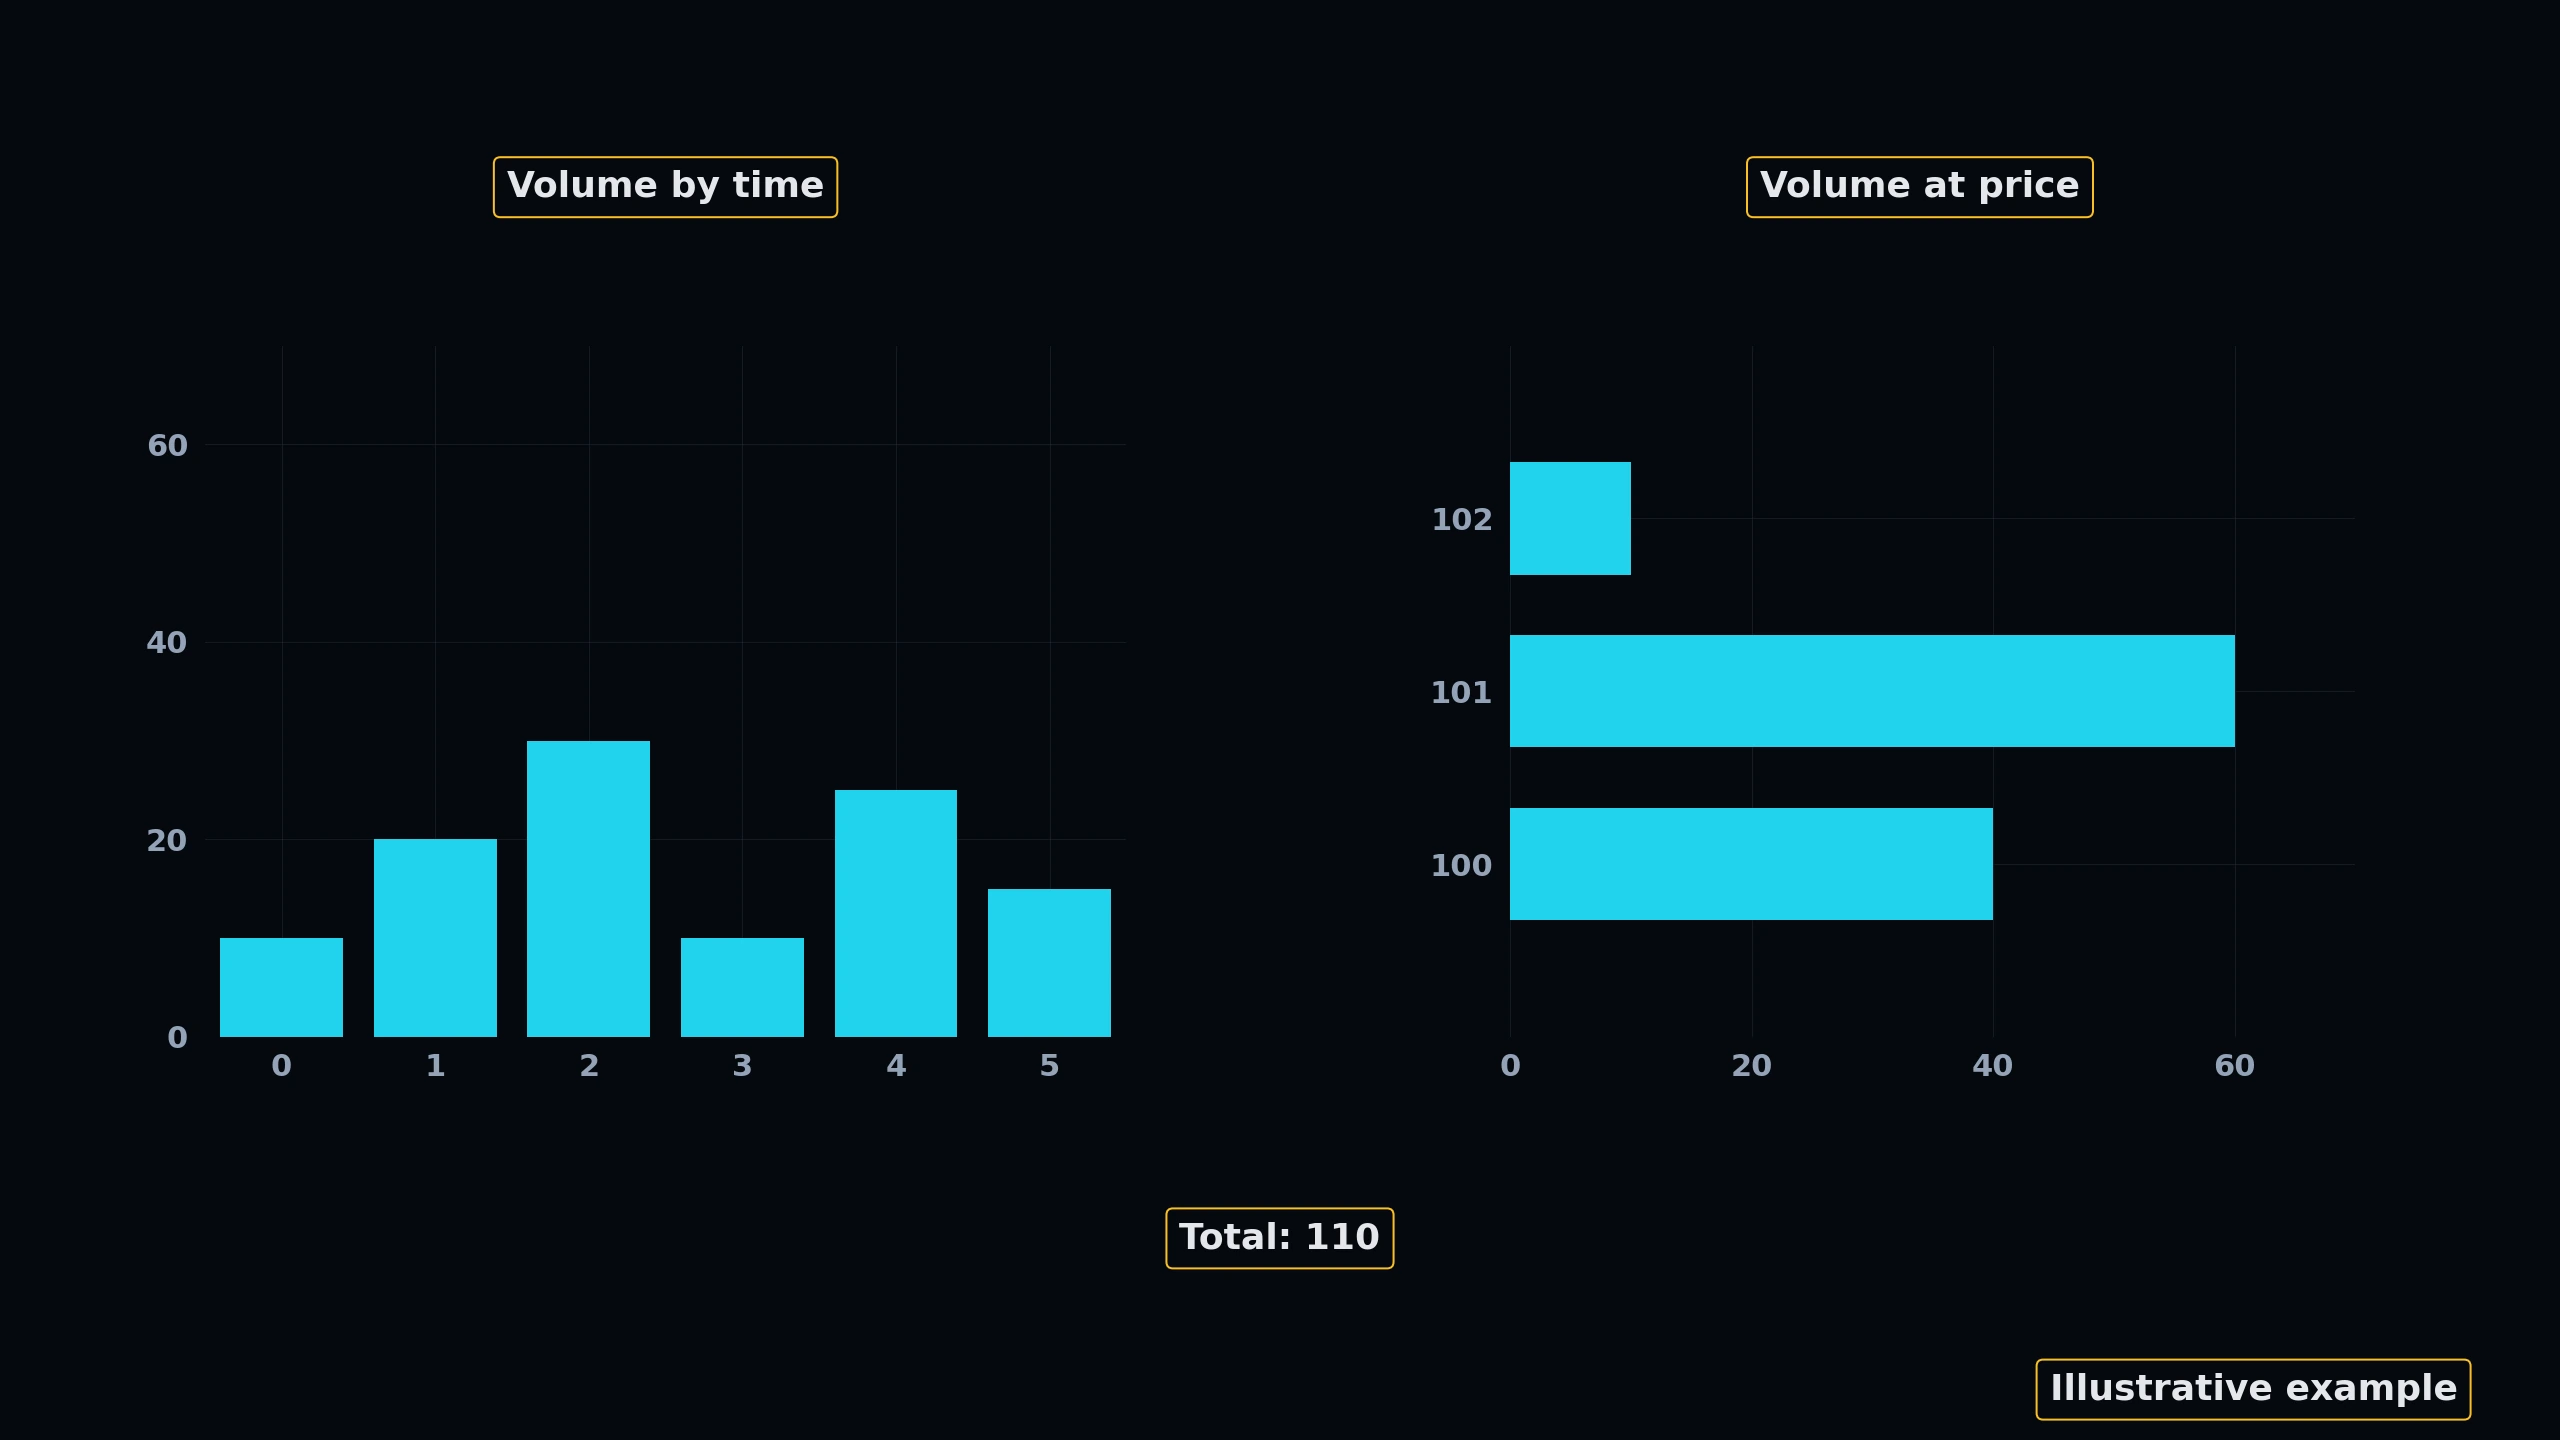
Unlike traditional volume charts that display trading volume vertically at the bottom of the screen (measuring volume over a specific time period), Volume Profile plots volume horizontally along the y-axis, representing the total volume traded at specific price levels.
This provides traders with a clear view of price levels where high and low trading activity took place, revealing institutional interest and key value areas.
★ Core Benefit: Volume Profile helps you identify where large market participants are actively buying and selling, transforming raw price charts into highly structured support and resistance maps.
2. Volume-At-Price vs. Volume-At-Time
Traditional volume indicators show when trading activity occurred, but they fail to show the price level at which that activity occurred. A sudden spike in volume on a 15-minute candle could have happened at the very top, middle, or bottom of the candle's range.
Volume Profile isolates the price element. By aggregating all trades executed at each individual tick, it highlights precisely where the market spent time and capital, exposing the fair value and unfair price levels of any given asset.
 Click to enlarge
Interactive Volume Profile Canvas
Volume profile plots the cumulative volume traded at specific price levels, revealing the Point of Control (POC - price of highest volume) and the Value Area (where 70% of transactions occur).
Profile Controls
KNOWLEDGE RECONNAISSANCE
What is the primary difference between Volume Profile and traditional volume indicators?
More lessons in this module
- 11.1: Building a Volume Profile
- 11.2: Point of Control (POC)
- 11.3: The Value Area (VAH & VAL)
- 11.4: High Volume Nodes (HVN)
- 11.5: Low Volume Nodes (LVN)
- 11.6: Composite Profiles
- 11.7: Volume Profile Strategies
- 11.8: Practical Application: Profile Playbook
Signal Desk is where you practice this on real stocks: real option chains (about 15 minutes delayed), the Trade Check and a paper-trading account that risks no real money. Join to add it, your progress tracking and PDF downloads.