
A hands-on options curriculum covering real trading concepts. Read the lessons, work through examples, and test your knowledge.
OVERALL ACADEMY PROGRESS
Free Lesson
Every lesson is free to read. Subscribe to add Signal Desk, progress tracking, PDF downloads and the lesson tutor.
Lesson 1: 11.1: Building a Volume Profile
Learn how a volume profile is calculated and constructed from historical trade data.
1. The Calculation Process
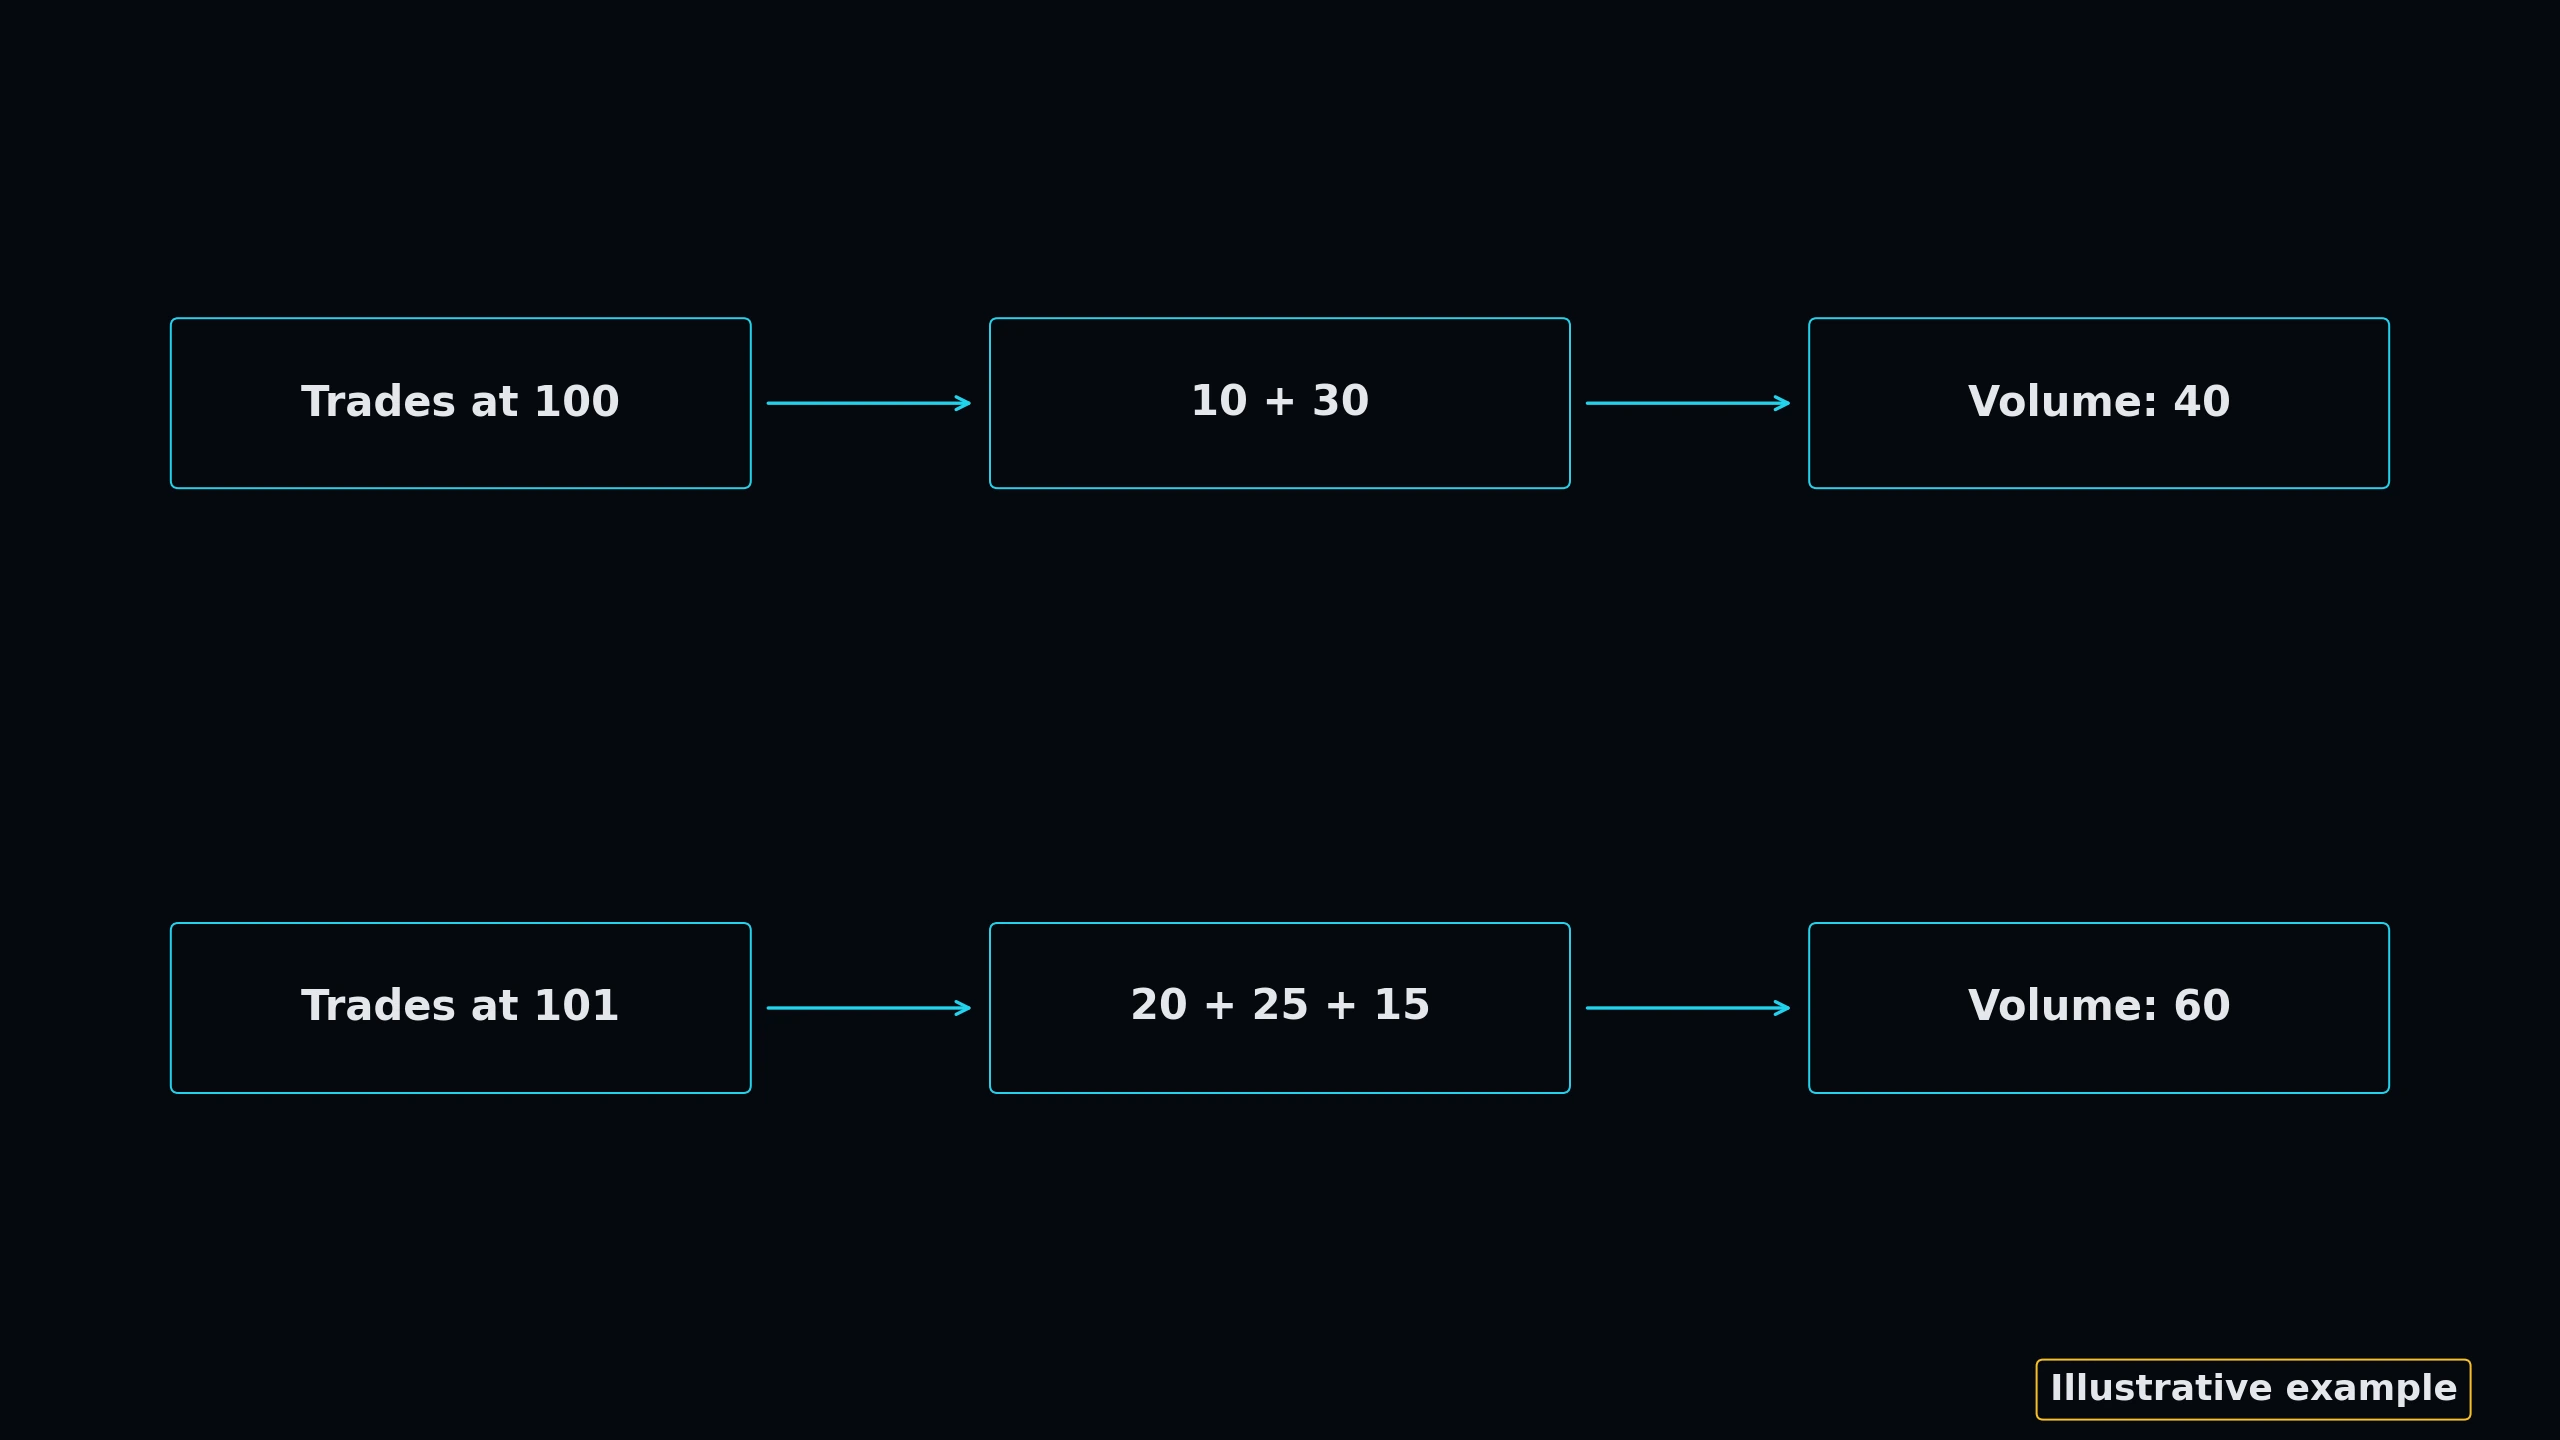
To build a volume profile, a trading platform aggregates every transaction executed within a selected timeframe. It records the size (volume) of each trade and matches it to the exact price tick at which it occurred.
These values are then summed up for each price row, creating horizontal bars. The longer the horizontal bar, the more volume was executed at that specific price.
★ Calculation Key: A high-precision profile relies on tick-level data rather than minute-interval approximations to ensure exact volume-at-price placement.
2. Session vs. Visible Range Profiles
There are different types of profiles based on the data range selected:
• Session Profile (SP): Displays the volume profile for a single trading day, showing intraday auction dynamics.
• Visible Range (VR): Dynamically calculates and displays the profile for all price data currently visible on the user's screen.
• Anchored Profile: Calculated from a user-defined starting point (such as a major swing high or news event) to the present.
 Click to enlarge
Interactive Volume Profile Canvas
Volume profile plots the cumulative volume traded at specific price levels, revealing the Point of Control (POC - price of highest volume) and the Value Area (where 70% of transactions occur).
Profile Controls
KNOWLEDGE RECONNAISSANCE
Which type of Volume Profile dynamically updates when you scroll or zoom your chart?
More lessons in this module
- 11.0: Introduction to Volume Profile
- 11.2: Point of Control (POC)
- 11.3: The Value Area (VAH & VAL)
- 11.4: High Volume Nodes (HVN)
- 11.5: Low Volume Nodes (LVN)
- 11.6: Composite Profiles
- 11.7: Volume Profile Strategies
- 11.8: Practical Application: Profile Playbook
Signal Desk is where you practice this on real stocks: real option chains (about 15 minutes delayed), the Trade Check and a paper-trading account that risks no real money. Join to add it, your progress tracking and PDF downloads.