
A hands-on options curriculum covering real trading concepts. Read the lessons, work through examples, and test your knowledge.
OVERALL ACADEMY PROGRESS
Free Lesson
Every lesson is free to read. Subscribe to add Signal Desk, progress tracking, PDF downloads and the lesson tutor.
Key terms in this lesson
 Click to enlarge
Lesson 3: 2.2: Vega, Implied Volatility & IV Rank
Why the same option costs different amounts on different days, and how IV rank tells you whether premium is expensive enough to be worth selling.
1. Implied Volatility — The Market's Forecast
Implied volatility is the market's collective estimate of how much a stock will move over the life of an option, expressed as an annualized percentage.
It is not a forecast of direction. A stock with 40% IV is expected to move a lot — in either direction. IV is a measure of expected magnitude only.
Crucially, IV is derived backwards from the option's price. Traders do not set IV directly; they buy and sell options, and IV is the number implied by what they pay.
★ Core Fact: High IV means options are expensive. Low IV means options are cheap. This is true regardless of what the stock subsequently does.
2. Vega — Sensitivity to Volatility
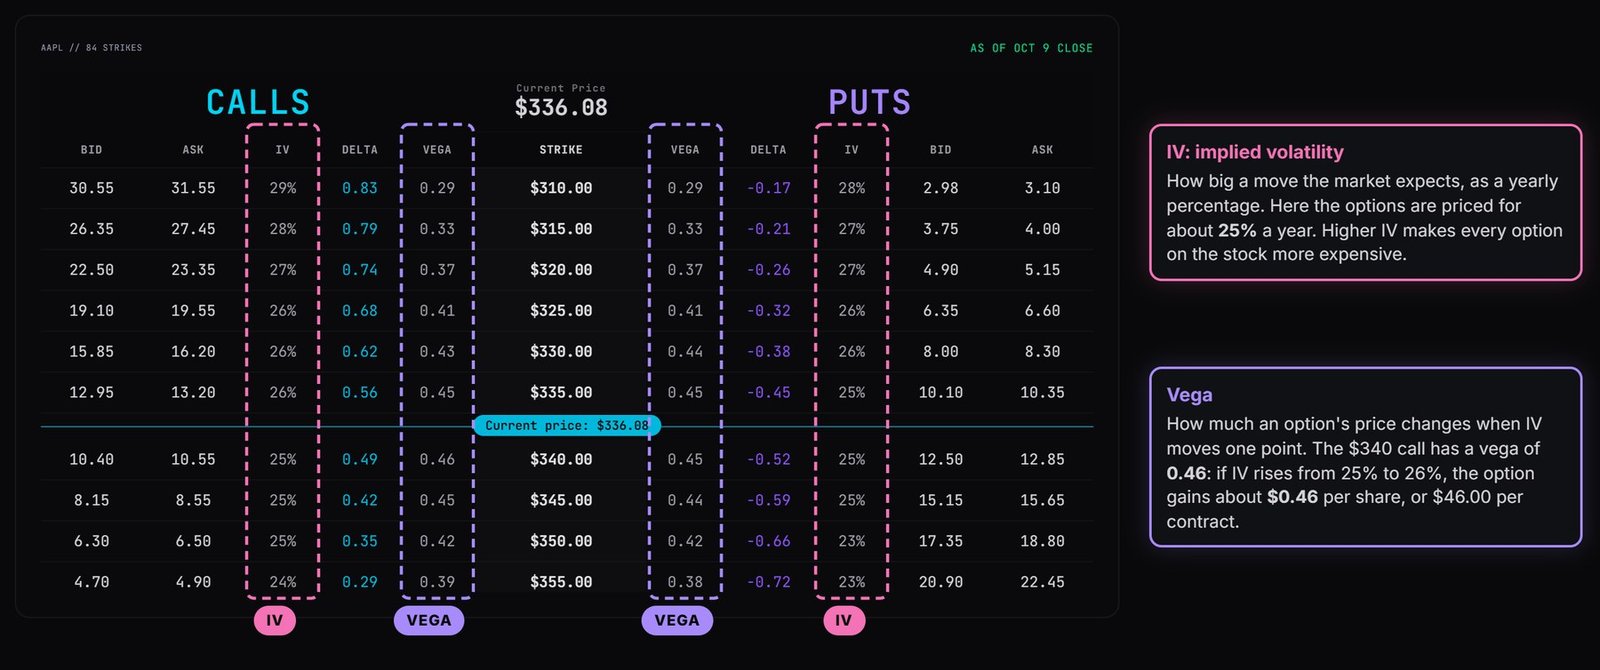
Vega measures how much an option's premium changes per one percentage point change in implied volatility.
Worked example: An option priced at $4.00 has a vega of 0.12.
• IV rises from 30% to 35% (+5 points) → premium gains roughly 5 × $0.12 = $0.60, to about $4.60
• IV falls from 30% to 22% (−8 points) → premium loses roughly $0.96, to about $3.04
Long options have positive vega — they benefit from rising volatility. Short options have negative vega — they benefit when volatility falls.
Vega is largest for at-the-money options with substantial time remaining, and shrinks toward zero as expiration nears. A contract expiring tomorrow barely responds to volatility changes because there is almost no time left for that volatility to materialize.
 Click to enlarge
3. The Same Option, Two Different Prices
This example explains a phenomenon that confuses nearly every new options trader.
Stock XYZ trades at $100. Consider the 45-day ATM call in two different market environments:
• Quiet market, IV at 20%: premium roughly $2.30
• Nervous market before an announcement, IV at 45%: premium roughly $5.20
Identical stock price. Identical strike. Identical time remaining. More than double the cost. The only difference is what the market expects to happen.
⚠️ Risk Warning: Buying options when IV is elevated means paying for movement that is already expected. If that movement occurs but IV collapses back to normal, you can be right on direction and still lose. This is the mechanism behind the earnings IV crush covered in Lesson 5.2.
4. IV Rank — The Number That Makes IV Actionable
Raw IV is nearly useless on its own, because normal IV differs enormously between stocks. A utility company at 25% IV is unusually volatile. A biotech at 25% IV is unusually calm.
IV Rank solves this by comparing current IV to that same stock's own range over the past year.
★ IV Rank = (Current IV − 52-week Low IV) ÷ (52-week High IV − 52-week Low IV) × 100
Worked example: A stock's IV ranged from 18% to 58% over the past year and currently sits at 38%.
• IV Rank = (38 − 18) ÷ (58 − 18) × 100 = 20 ÷ 40 × 100 = 50
An IV Rank of 50 means current volatility sits exactly midway through its own annual range.
Interpretation used by most premium sellers:
• IV Rank above 50: options are expensive relative to this stock's history — favourable for selling premium
• IV Rank 30 to 50: moderate — acceptable for selling, with smaller size
• IV Rank below 30: options are cheap — poor conditions for selling, potentially reasonable for buying
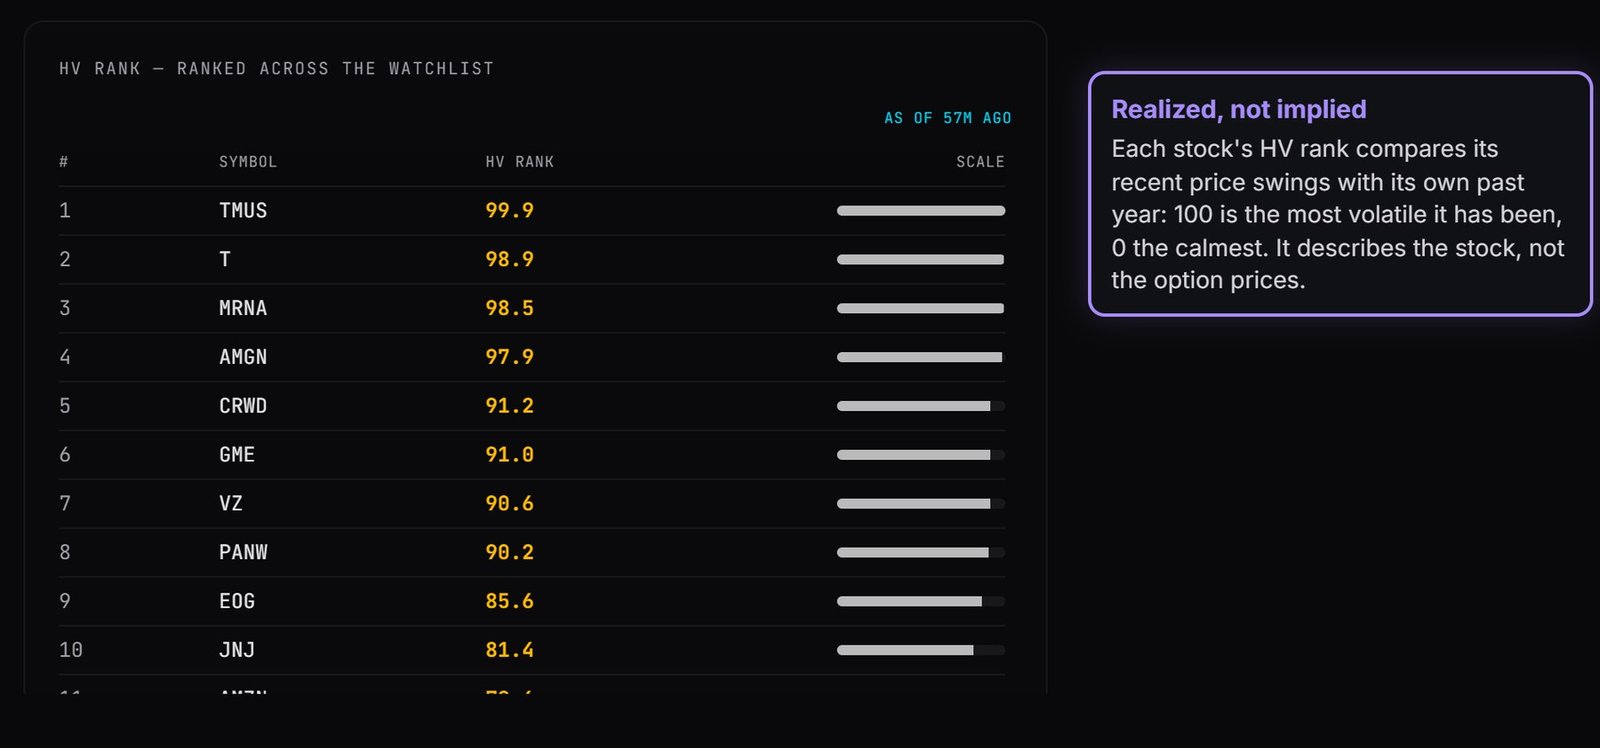
★ In Signal Desk: Signal Desk does not show a full IV Rank yet, because that needs a year of stored IV for every stock. Use two stand-ins instead: the HV Rank on the Market tab, and the line in Trade Check that compares an option's IV with the stock's realized volatility. When both say premium is rich, they point the same way a high IV Rank would.
 Click to enlarge
5. Why This Governs Strategy Selection
IV Rank is the single best filter for deciding which type of strategy suits current conditions.
• High IV Rank (above 50): Sell premium. Cash-secured puts, covered calls, iron condors, credit spreads. You are selling something the market has priced richly, and you benefit if volatility normalizes downward.
• Low IV Rank (below 30): Buying is comparatively attractive. Long calls, long puts, debit spreads, calendars. You are paying less for the same exposure.
This is why experienced traders do not have a single favourite strategy. They have a set of strategies and select among them based on what the volatility environment is offering.
★ Practical Guidance: Before entering any premium-selling trade in this course, check IV Rank. Selling a cash-secured put at IV Rank 12 means accepting the full obligation of the position while being paid unusually little for it.
6. Try It in Signal Desk
Open the Market tab in Signal Desk and look at the HV Rank list. It ranks the watchlist by how high each stock's realized volatility is against its own past year. Pick three names: a large stable one, a high-growth technology one and a company with earnings in the next two weeks.
Open each one on the Options page and record the implied volatility (IV) of the at-the-money option, then open Trade Check and note whether it says IV is above or below the stock's realized volatility.
You will typically find the earnings name showing elevated IV: the market pricing in a known upcoming event. That is exactly the environment premium sellers look for, and exactly the trap that catches option buyers who do not check. Signal Desk shows HV Rank and the IV-versus-realized comparison; a full IV Rank also needs a year of stored IV, which the lesson describes.
See it in Signal Desk
Signal Desk shows implied volatility on every strike and compares it with the stock's realized volatility (members see live quotes).
- 1
Open the Market tab and find "HV rank, ranked across the watchlist". A high number means the stock's recent price swings are large compared with its own past year.
- 2
Open Options, load a ticker and read the IV column for the strikes near the price. This is the market's forecast of movement, as an annual percentage.
- 3
Tap a strike in the Easy Chain and read its implied volatility and vega in the details. Vega is how much the option price moves for a one-point change in IV.
- 4
Pick a trade and open the Trade Check. One of its lines compares the option's IV with the stock's realized volatility and tells you plainly whether premium looks rich or thin.
- 5
Look for the earnings tag on the expirations. IV is usually higher on dates that include a report.
KNOWLEDGE RECONNAISSANCE
What does implied volatility measure?
An option priced at $4.00 has a vega of 0.12. IV rises by 5 percentage points. What is the approximate new premium?
A stock's IV ranged from 20% to 60% over the past year and currently sits at 50%. What is its IV Rank?
Why is raw implied volatility misleading without IV Rank?
IV Rank on a stock you follow is 15. Which approach does this environment favour?
You buy a call before earnings when IV is elevated. The stock moves in your favour but you lose money. What most likely happened?
More lessons in this module
See every lesson in the courseSignal Desk is where you practice this on real stocks: real option chains (about 15 minutes delayed), the Trade Check and a paper-trading account that risks no real money. Join to add it, your progress tracking and PDF downloads.