
A hands-on options curriculum covering real trading concepts. Read the lessons, work through examples, and test your knowledge.
OVERALL ACADEMY PROGRESS
Free Lesson
Every lesson is free to read. Subscribe to add Signal Desk, progress tracking, PDF downloads and the lesson tutor.
Lesson 3: 8.2: Volume Profile & Point of Control (POC)
Analyze volume across price levels rather than time to identify horizontal support, resistance, and value areas.
1. Time vs. Price Volume
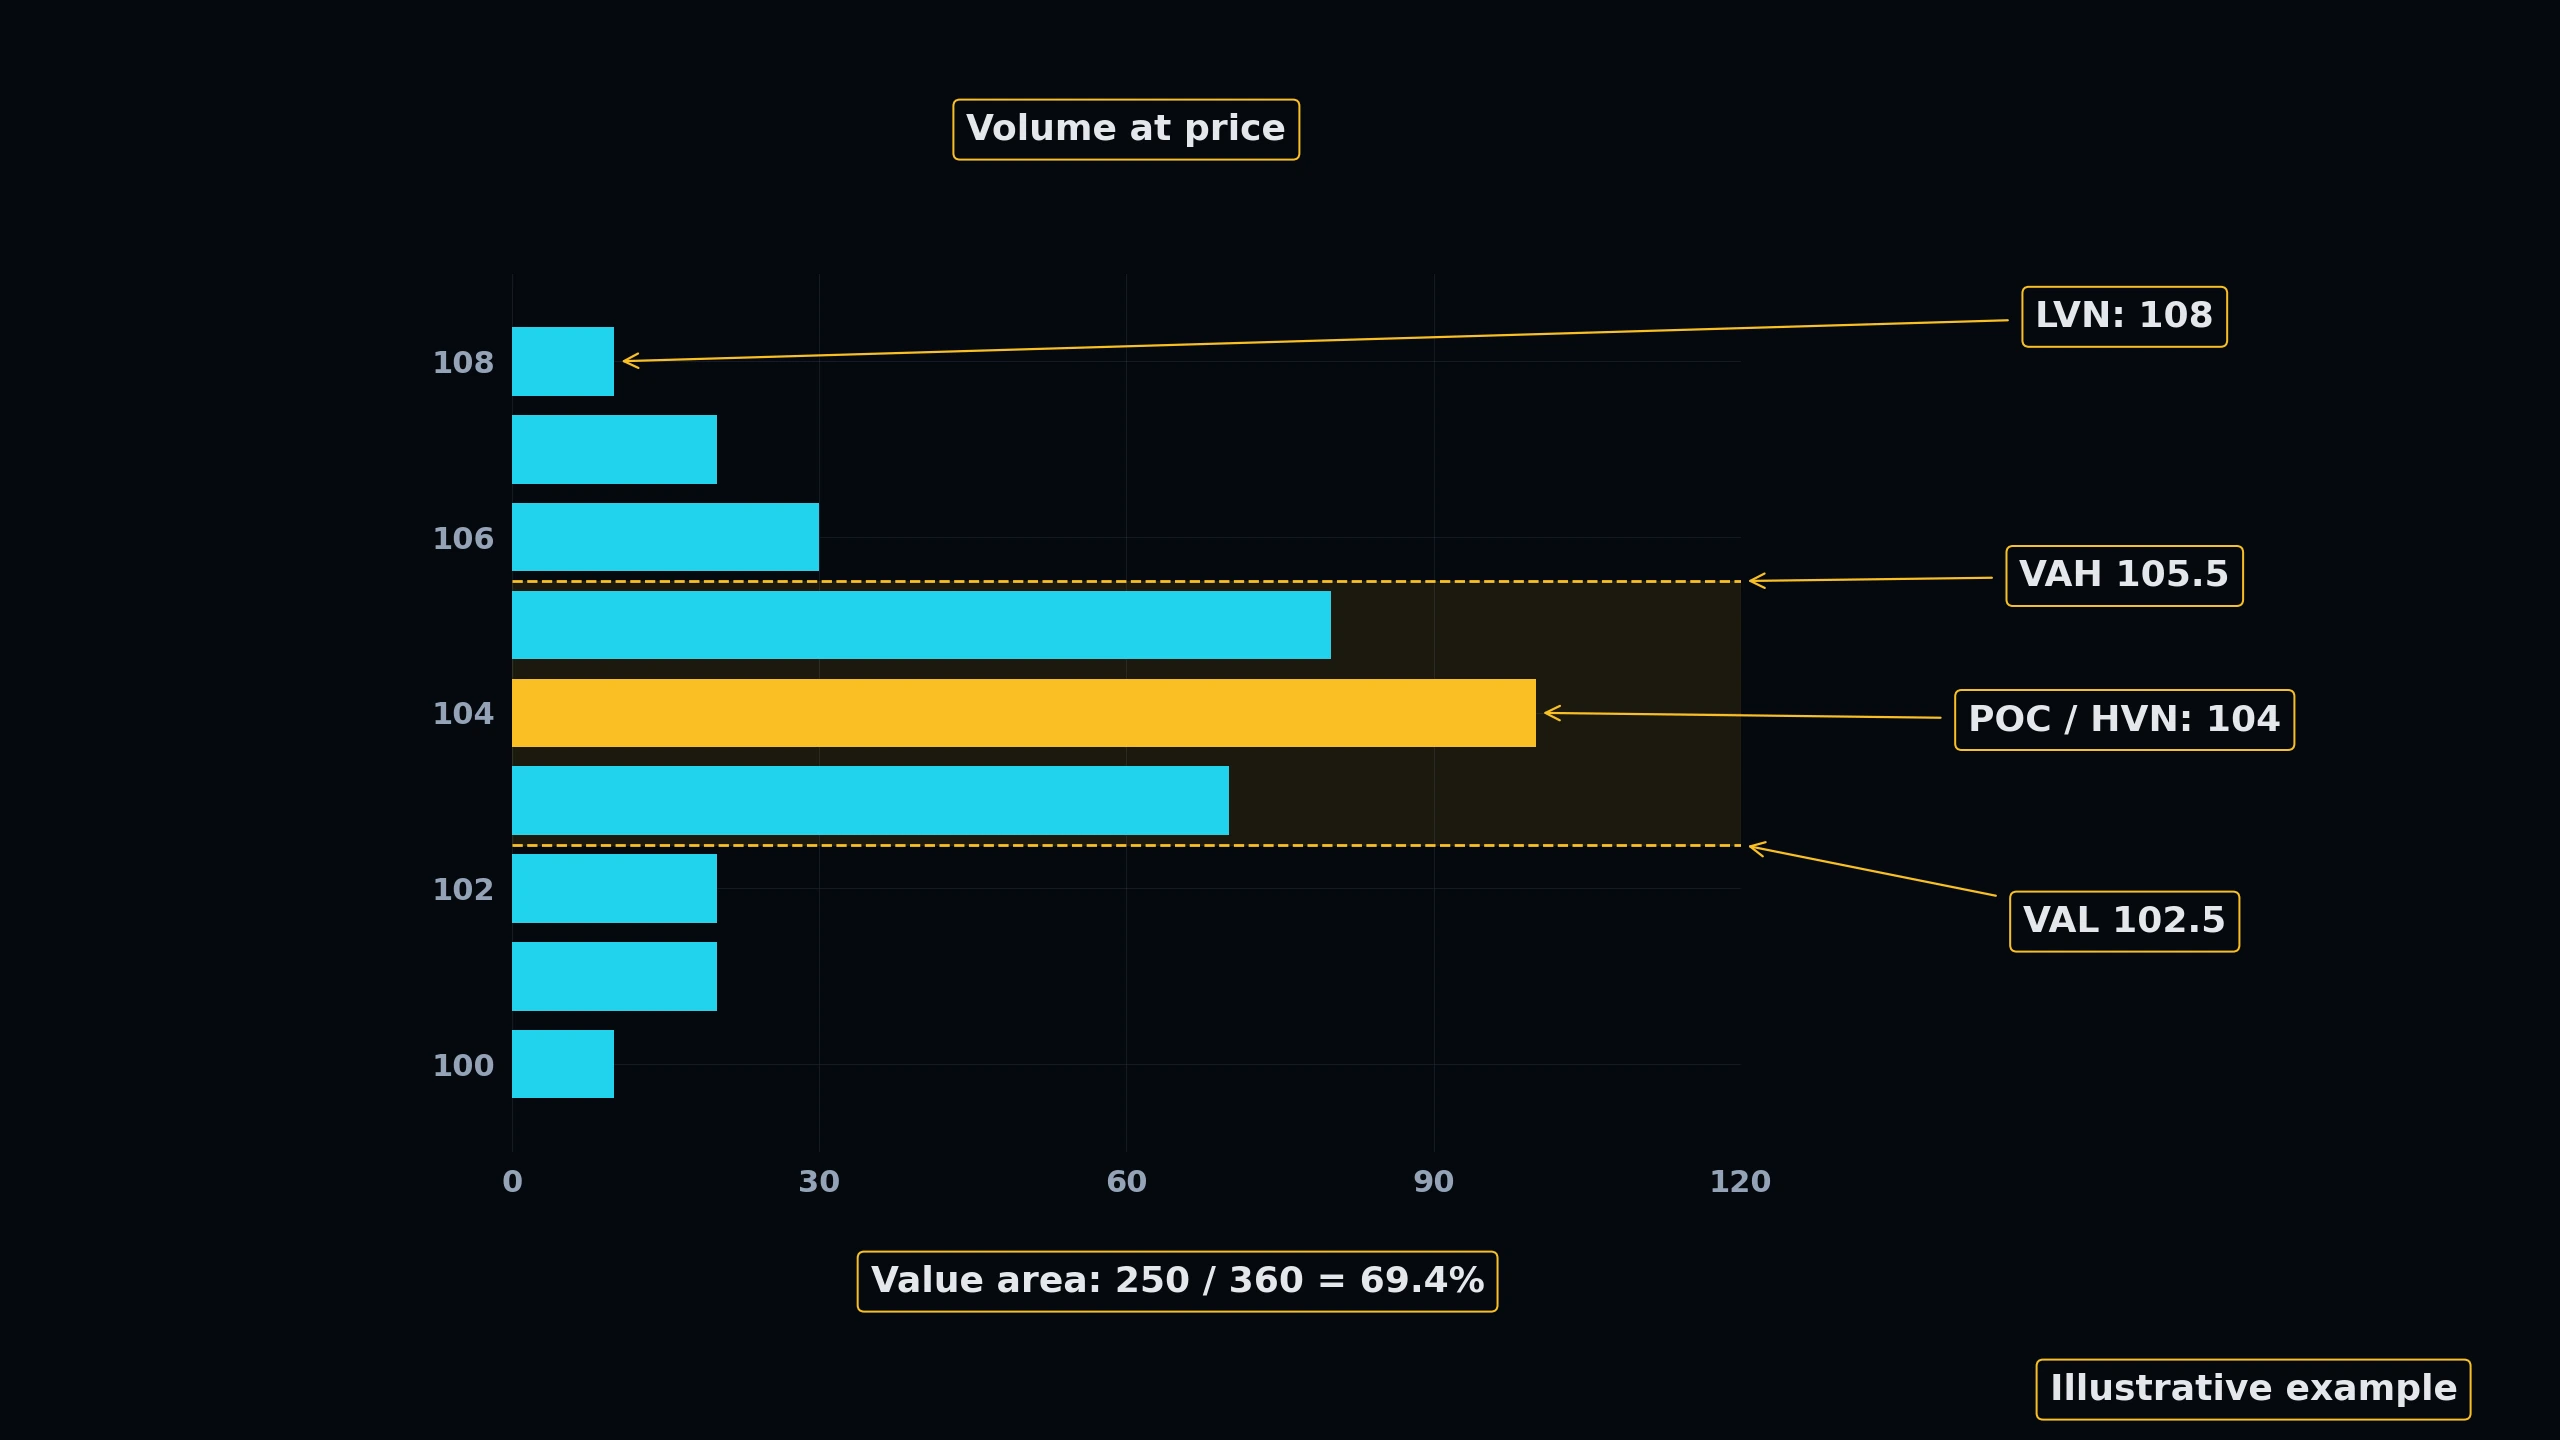
Traditional volume is displayed at the bottom of a chart, showing volume over time. Volume Profile displays volume horizontally on the y-axis, showing exactly how much volume traded at specific price levels.
This reveals the horizontal price levels where the highest amount of interest and transactions took place. Key terms include:
• Point of Control (POC): The price level with the single highest traded volume in the profile. It acts as an incredibly strong magnet and major support/resistance.
• Value Area (VA): The range of price levels where 70% of the total volume was traded during the selected period.
2. High and Low Volume Nodes
High Volume Nodes (HVNs) represent price levels where buyers and sellers have agreed on fair value, creating flat trading zones. Low Volume Nodes (LVNs) represent price levels where little to no volume was traded, acting as high-speed slipways where price tends to shoot through quickly.
 Click to enlarge
KNOWLEDGE RECONNAISSANCE
What is the Point of Control (POC) in a Volume Profile?
How does price typically behave when entering a Low Volume Node (LVN)?
More lessons in this module
- 8.0: Volume Foundations & Institutional Footprints
- 8.1: Volume Spread Analysis (VSA)
- 8.3: Volume Weighted Average Price (VWAP) & Anchored VWAP
- 8.4: Volume-Based Breakouts & Validation
Signal Desk is where you practice this on real stocks: real option chains (about 15 minutes delayed), the Trade Check and a paper-trading account that risks no real money. Join to add it, your progress tracking and PDF downloads.