
A hands-on options curriculum covering real trading concepts. Read the lessons, work through examples, and test your knowledge.
OVERALL ACADEMY PROGRESS
Free Lesson
Every lesson is free to read. Subscribe to add Signal Desk, progress tracking, PDF downloads and the lesson tutor.
Lesson 3: 7.2: Trendlines, Channels & Acceleration
Learn the geometric rules for drawing valid trendlines, building channels, and spotting trend acceleration.
1. Rules for Valid Trendlines
A trendline is a straight line connecting a series of price pivots. To draw a valid bullish trendline, you must connect at least two consecutive swing lows (ideally three or more for confirmation).
A bearish trendline connects a series of consecutive swing highs. The slope of a trendline shows the strength of the trend: a slope steeper than 45 degrees is often unsustainable and prone to sharp corrections.
★ Drawing Rule: Never force a trendline to fit the price. Let the real structural pivots guide the line naturally.
2. Price Channels and Trend Acceleration
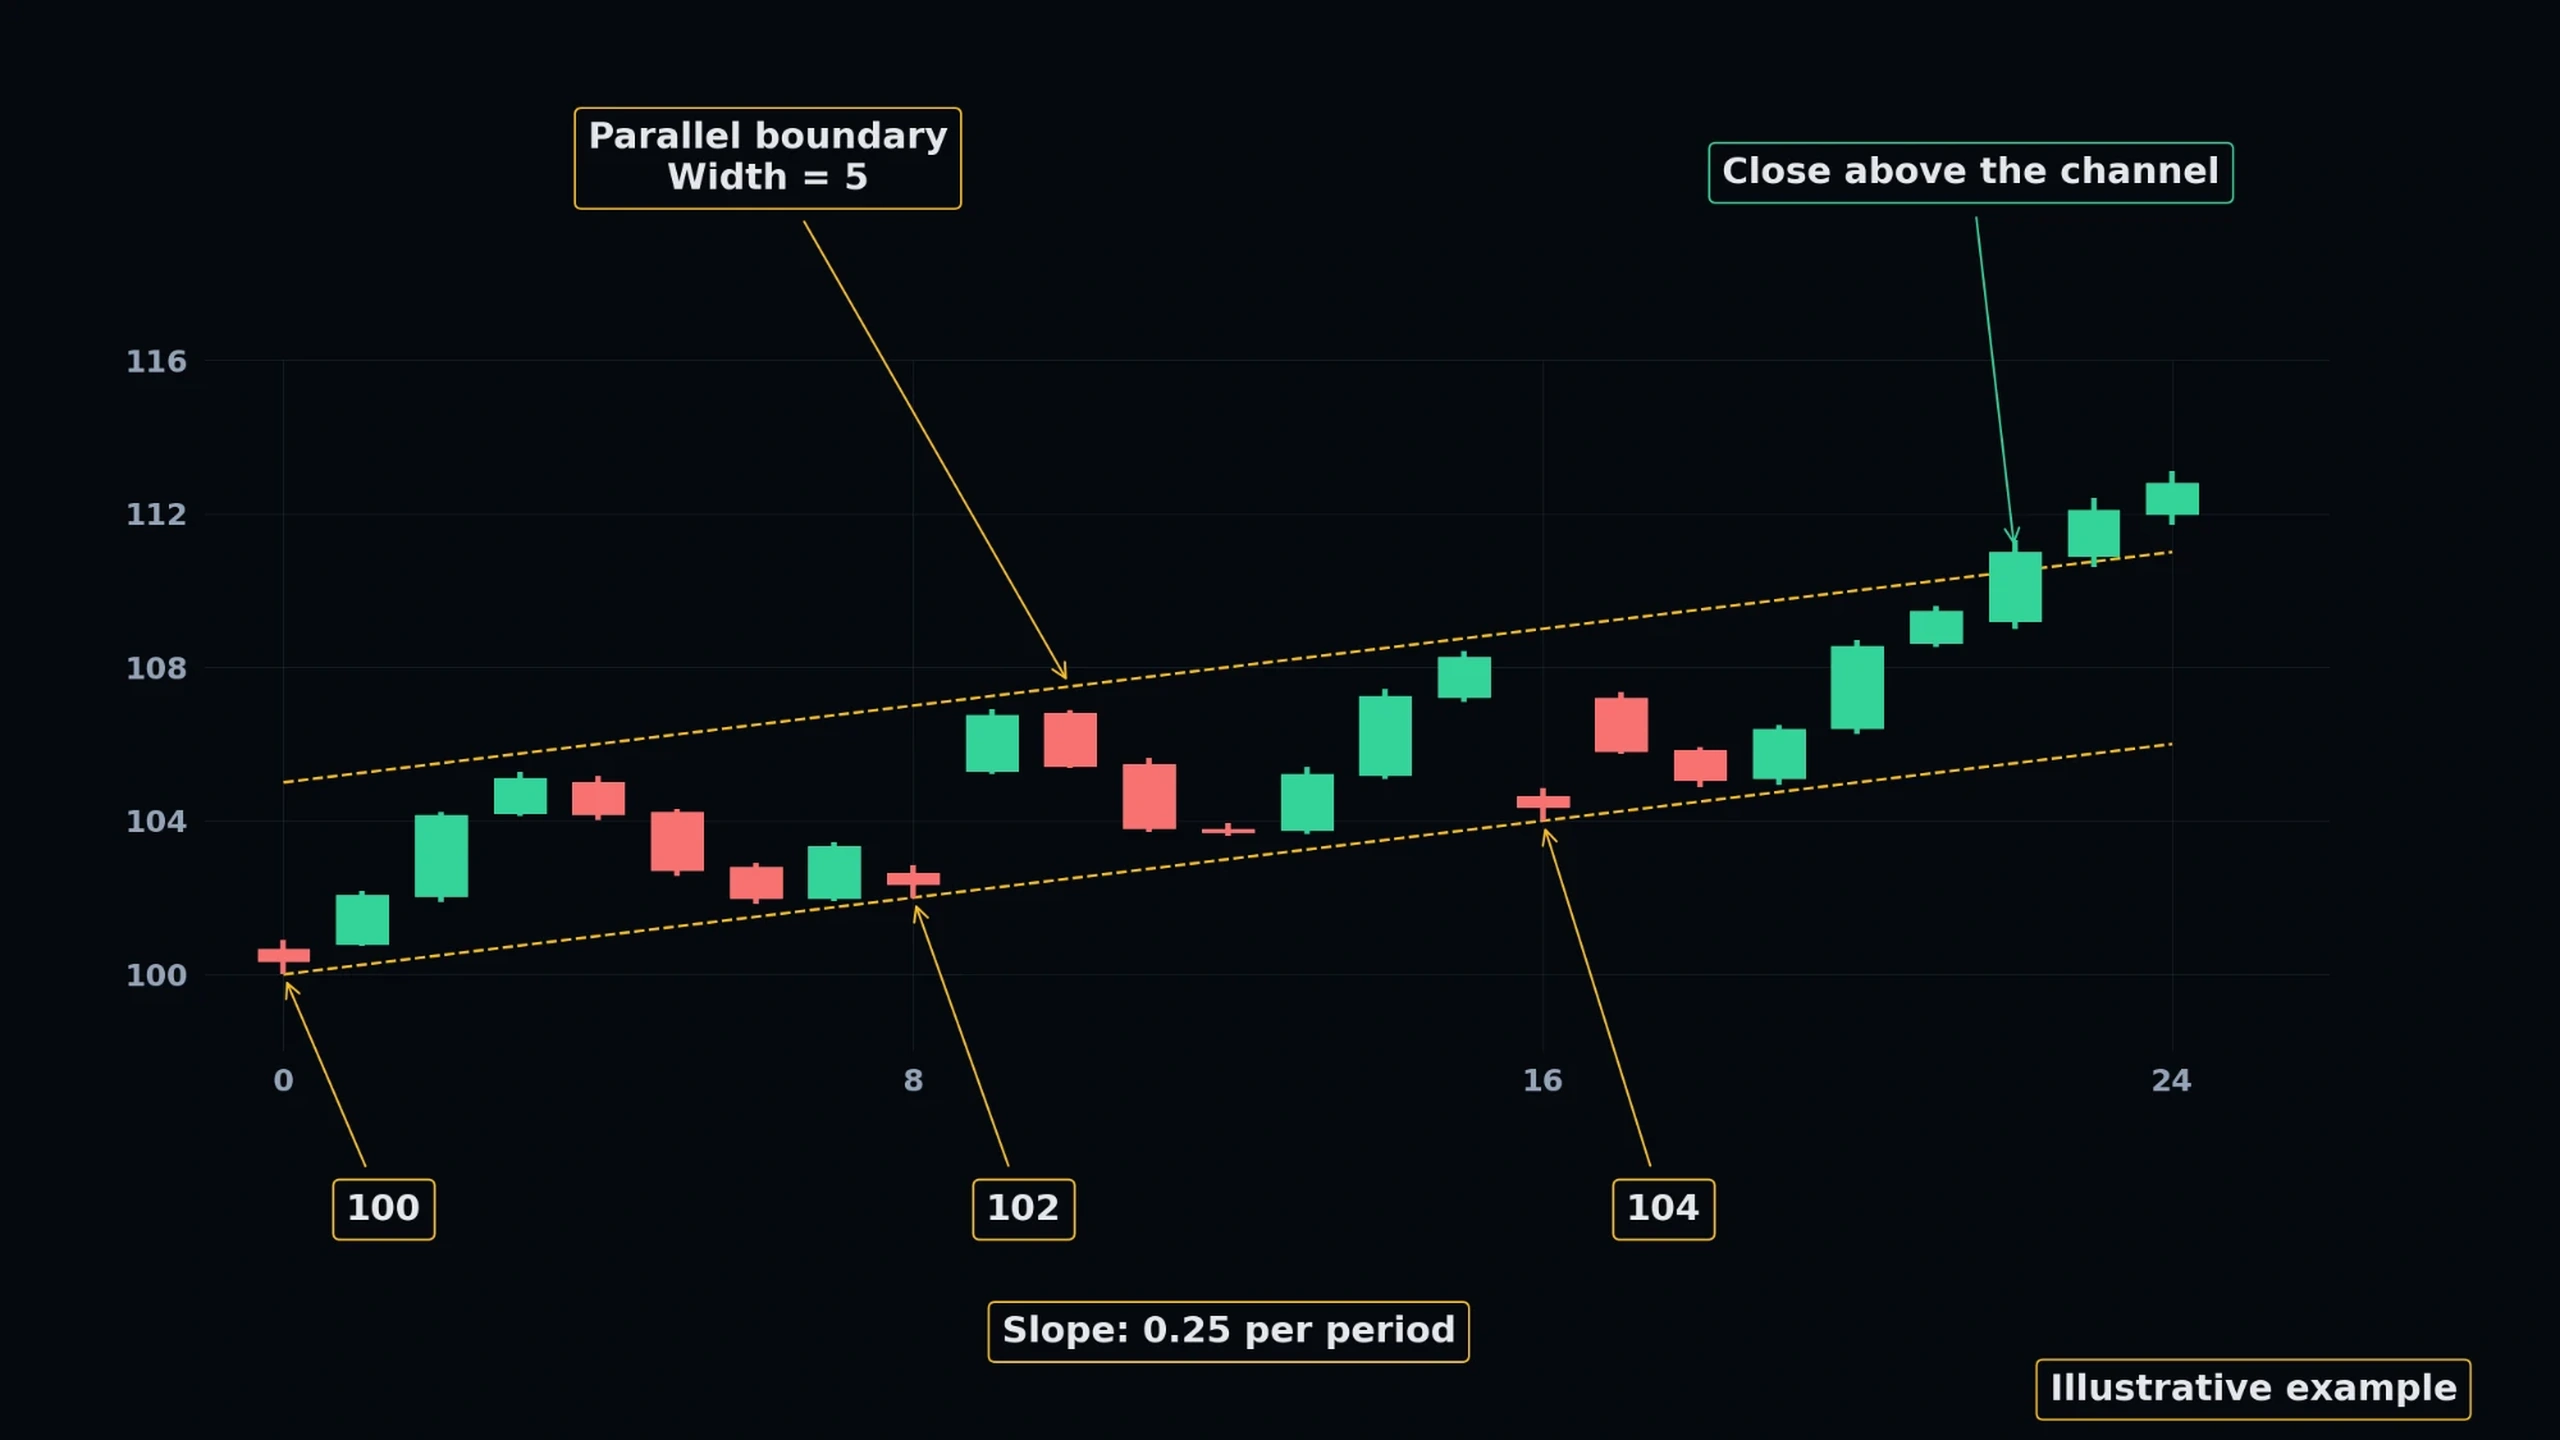
An Equidistant Channel is formed by drawing a parallel line to your trendline on the opposite side of the price action. It defines the boundaries of the trend.
Trend Acceleration occurs when price breaches the top of an uptrend channel, indicating surging momentum. Conversely, breaking a trendline to the downside signals potential trend exhaustion or reversal.
 Click to enlarge
KNOWLEDGE RECONNAISSANCE
How many structural price touches are minimum required to confirm a highly valid trendline?
More lessons in this module
- 7.0: Foundations of Trend Theory
- 7.1: Moving Averages as Dynamic Support & Resistance
- 7.3: Average Directional Index (ADX) & Momentum
- 7.4: Trend Reversals vs. Pullbacks
Signal Desk is where you practice this on real stocks: real option chains (about 15 minutes delayed), the Trade Check and a paper-trading account that risks no real money. Join to add it, your progress tracking and PDF downloads.