
A hands-on options curriculum covering real trading concepts. Read the lessons, work through examples, and test your knowledge.
OVERALL ACADEMY PROGRESS
Free Lesson
Every lesson is free to read. Subscribe to add Signal Desk, progress tracking, PDF downloads and the lesson tutor.
Lesson 2: 7.1: Moving Averages as Dynamic Support & Resistance
Understand Simple and Exponential Moving Averages, crossovers, and how to use them as dynamic boundaries.
1. SMA vs. EMA Mechanics
Moving averages (MAs) smooth out price action by filtering out short-term market noise. The two most common types are the Simple Moving Average (SMA) and the Exponential Moving Average (EMA).
The SMA calculates the average price over a specific number of periods, weighting all days equally. The EMA applies more weight to recent prices, making it react faster to current price movements.
★ Pro Rule: Use EMAs (like the 9, 21, and 50) for short-term swing trading, and SMAs (like the 50, 100, and 200) for long-term trend identification.
2. Crossovers & Dynamic Support
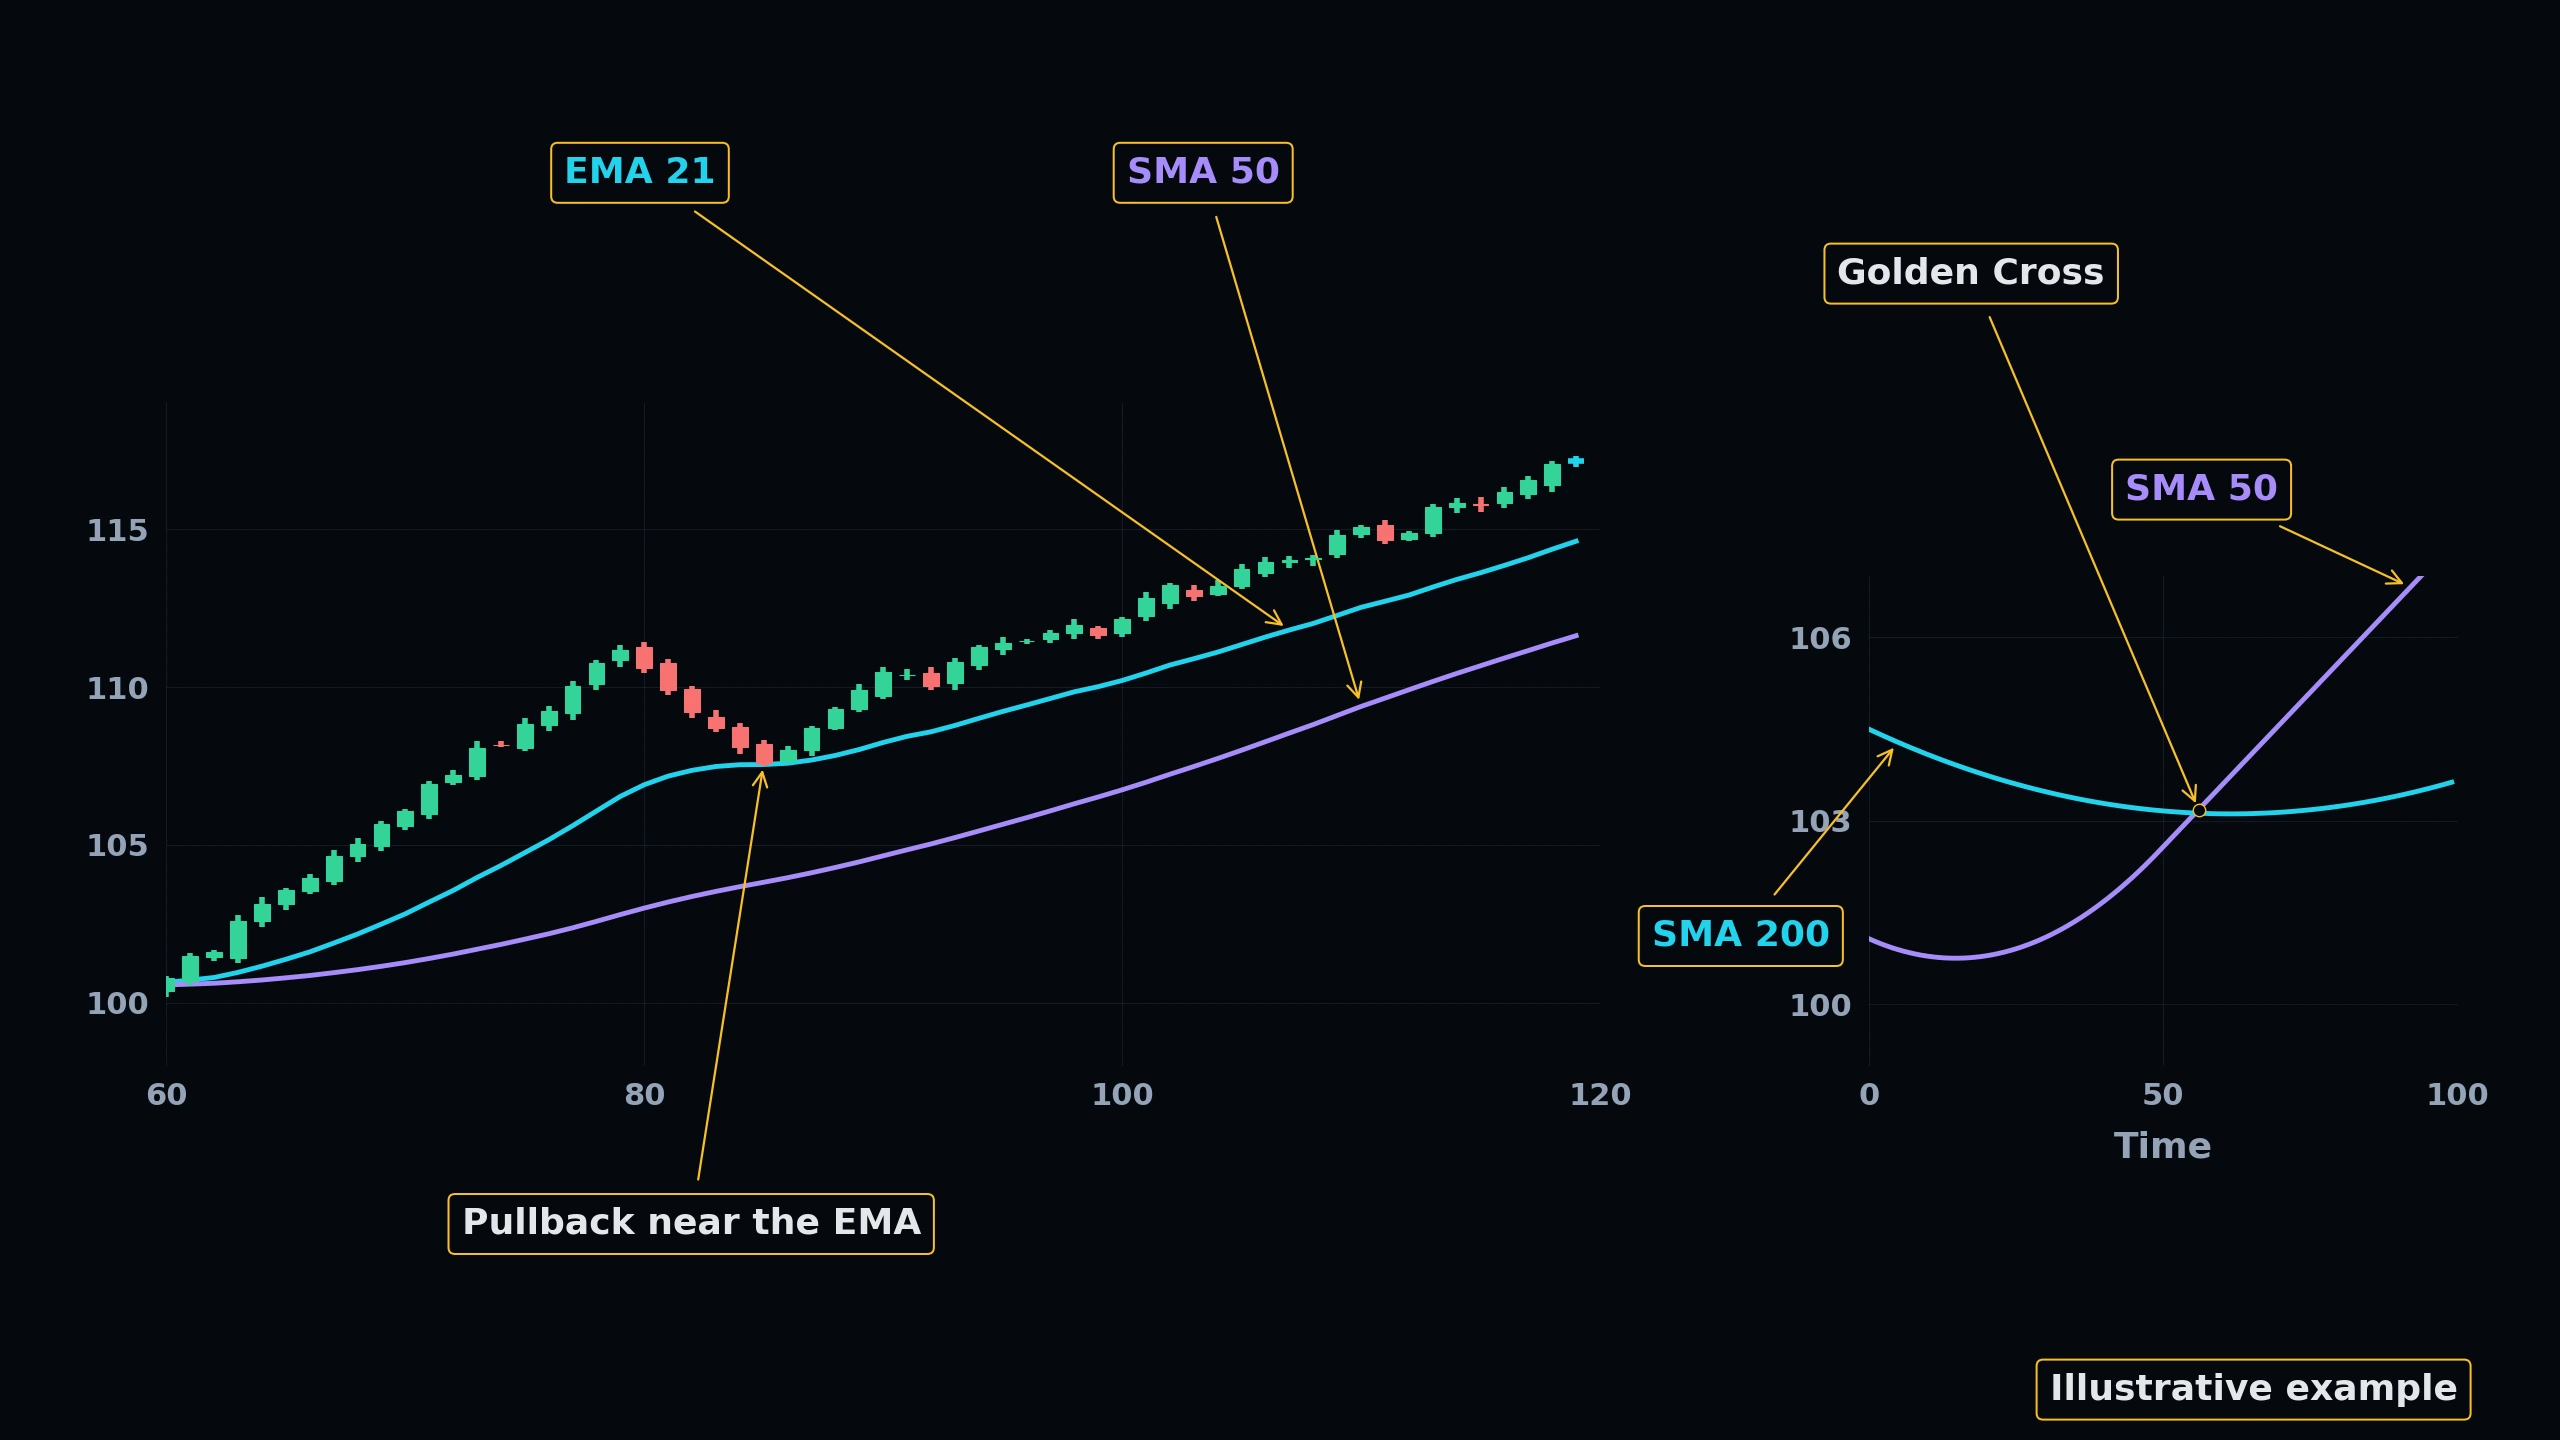
MAs act as dynamic support and resistance. In a strong uptrend, price frequently pulls back to the 21 EMA or 50 SMA and bounces, offering a high-probability entry.
Crossovers occur when a faster MA crosses a slower MA. The most famous are the Golden Cross (50 SMA crossing above 200 SMA), signaling a long-term bull market, and the Death Cross (50 SMA crossing below 200 SMA), signaling a structural bear market.
 Click to enlarge
KNOWLEDGE RECONNAISSANCE
What is the primary difference between a Simple Moving Average (SMA) and an Exponential Moving Average (EMA)?
More lessons in this module
- 7.0: Foundations of Trend Theory
- 7.2: Trendlines, Channels & Acceleration
- 7.3: Average Directional Index (ADX) & Momentum
- 7.4: Trend Reversals vs. Pullbacks
Signal Desk is where you practice this on real stocks: real option chains (about 15 minutes delayed), the Trade Check and a paper-trading account that risks no real money. Join to add it, your progress tracking and PDF downloads.