
A hands-on options curriculum covering real trading concepts. Read the lessons, work through examples, and test your knowledge.
OVERALL ACADEMY PROGRESS
Free Lesson
Every lesson is free to read. Subscribe to add Signal Desk, progress tracking, PDF downloads and the lesson tutor.
Key terms in this lesson
Lesson 1: 19.1: Merger & Risk Arbitrage (M&A Deal Structures & Break Spreads)
Master M&A deal structures, cash vs stock offers, break spread calculations, regulatory approval risks, and deal probability modeling.
1. M&A Deal Structure & Spread Capture
When a company announces an acquisition, the target company stock typically trades at a discount (deal spread) to the proposed offer price.
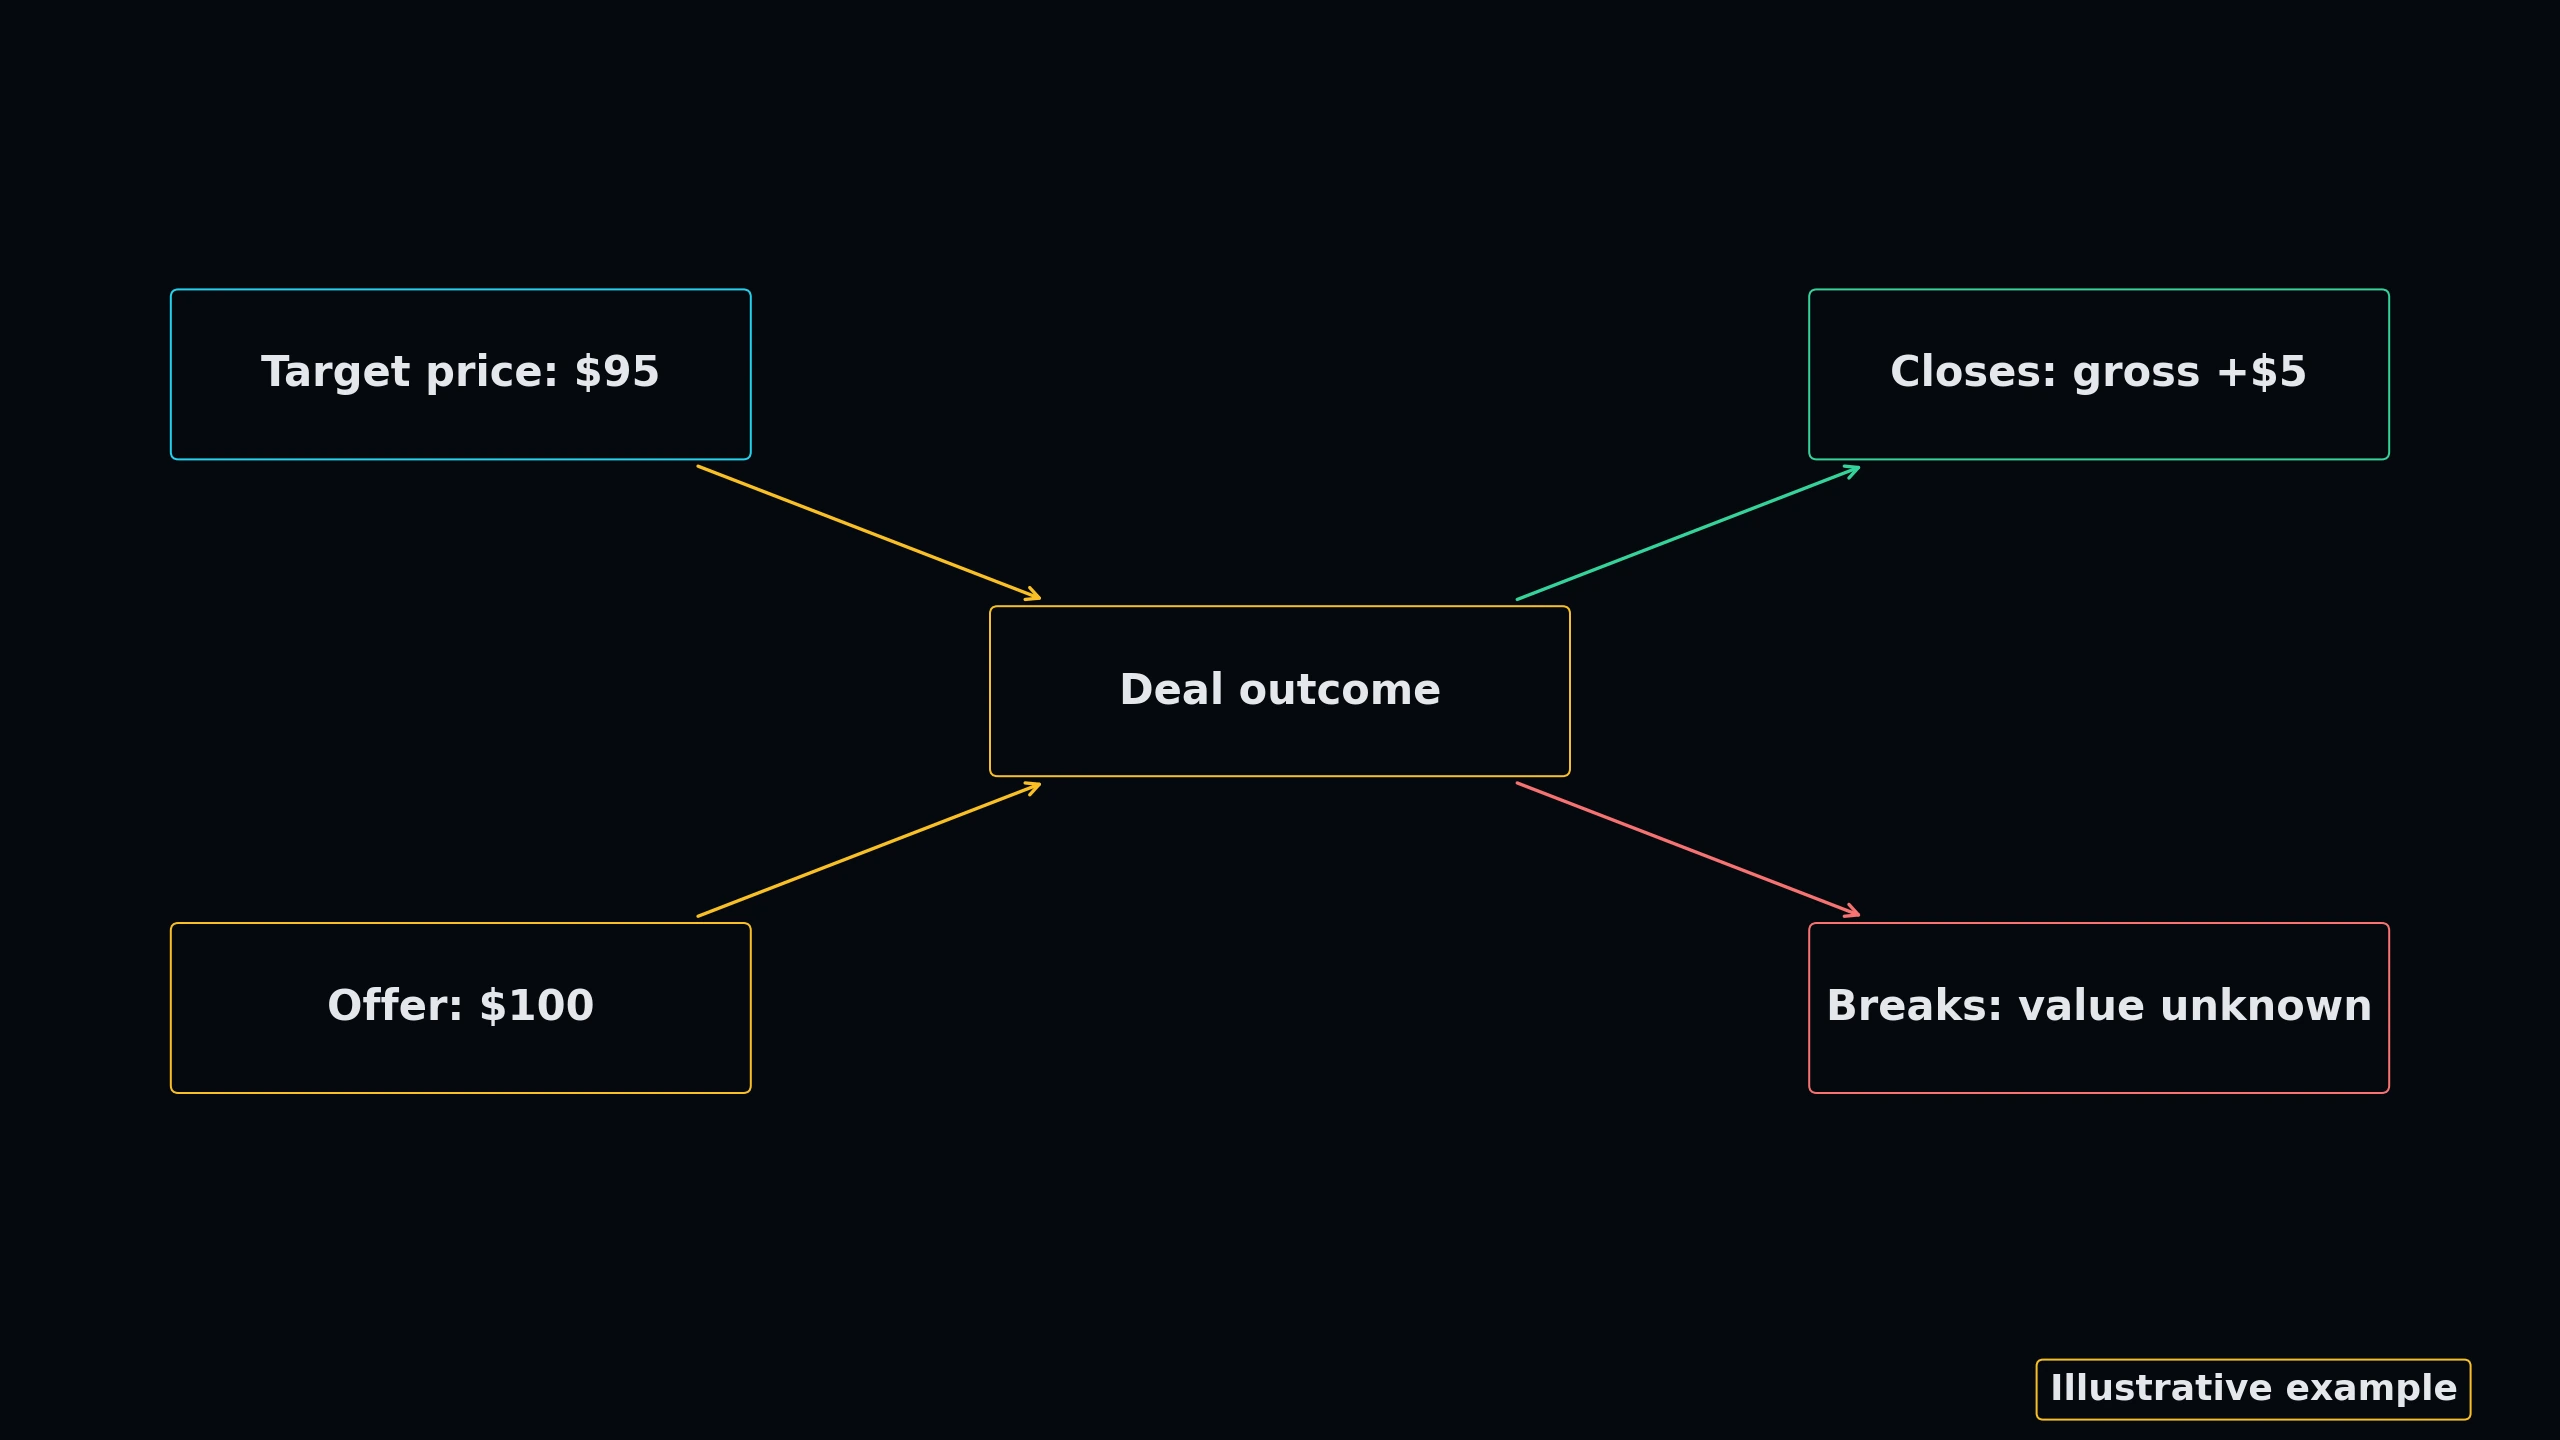
• Cash Deals: Arbitrageur buys target stock at $95, expecting $100 cash upon deal closure.
• Stock-for-Stock Deals: Arbitrageur buys target stock and shorts acquirer stock in the exact exchange ratio to lock in the spread.
★ Deal Break Risk: If antitrust regulators (FTC/DOJ) block the deal, the spread explodes and target stock crashes back to standalone valuation.
2. Quantifying Implied Deal Probability
Implied Probability = (P_current - P_standalone) / (P_offer - P_standalone). Quant desks continuously update deal probabilities based on regulatory filings and legal analysis.
 Click to enlarge
Options Structure Exploration
Options are contracts cleared in the bid-ask auction market. Interact with the Order Book below to understand how buy offers (bids) and sell offers (asks) intersect, and inspect the structural breakdown between Call and Put contracts.
Limit Order Book & Spread Interface
Hover over ASK or BID to dissect the auction market dynamics.
Right to Buy
- Outlook: Bullish (Goes up)
- Risk: Capped to premium paid
- Profit: Scales as stock surges
Right to Sell
- Outlook: Bearish (Goes down)
- Risk: Capped to premium paid
- Profit: Scales as stock falls
KNOWLEDGE RECONNAISSANCE
How does a merger arbitrageur structure a trade in a fixed-ratio stock-for-stock acquisition?
More lessons in this module
- 19.0: Overview of Global Arbitrage & Event-Driven Strategies
- 19.2: Convertible Bond Arbitrage & Delta-Neutral Volatility Trading
- 19.3: Fixed Income & Yield Curve Arbitrage (Treasury-Swap Spreads, Basis Trades)
- 19.4: Index Arbitrage & Program Trading Mechanics
- 19.5: Distressed Debt, Restructuring, & Bankruptcy Investing
- 19.6: Corporate Actions & Special Situations (Spin-offs, Tender Offers, Rights Offerings)
- 19.7: Cross-Border & ADR Arbitrage (FX & Capital Control Dynamics)
- 19.8: Quantitative Event-Driven Strategies (Earning Surprises, NLP Catalyst Feeds)
Signal Desk is where you practice this on real stocks: real option chains (about 15 minutes delayed), the Trade Check and a paper-trading account that risks no real money. Join to add it, your progress tracking and PDF downloads.