
Volatility · November 5, 2026 · 7 min read
Volatility Skew Explained: Compare IV Across Strikes
By Gerson Yoss
Volatility skew describes how implied volatility differs across option strikes for the same expiration. It compares a pricing input across contracts, rather than showing the stock’s price path.
This guide uses a made-up snapshot to explain the comparison and its limits. It also separates options skew from the statistical meaning of skewness. This is education, not a forecast or trading advice.
The short version
- Compare the same underlying and expiration when studying a strike-by-strike skew.
- Implied volatility is a pricing input inferred from an option’s price.
- A difference in percentage points is different from a relative percentage change.
- A skew snapshot is not a payoff, probability forecast or instruction to sell high-IV options.
What the curve compares
The OIC skew overview compares implied volatility, or IV, at different strikes within one expiration. It distinguishes a smile, with higher values on both wings, from a smirk, with one side elevated. The glossary entries for implied volatility and out of the money introduce the vocabulary.

A snapshot needs a clear identity. Which underlying is being compared? Which expiration? What moment? What option quotes and pricing assumptions produced the IV readings? An educational table can declare all of those as hypothetical. An observed table would need actual data and its timing. This article supplies no observed market data, so none of its numbers describes current demand for any real stock.
Keep strike, premium and IV in different columns
Strike is the contract’s exercise price. Premium is the option’s price. IV is expressed as a volatility figure rather than dollars. The vega and IV lesson covers vega, implied volatility and IV rank. Vega describes sensitivity to IV; the glossary defines vega. This article does not claim that the lesson teaches skew itself.
The OIC vega explanation treats vega as an estimate of option-price sensitivity to a change in IV, with other inputs held fixed. That is a different question from comparing the levels of IV at several strikes. A table of IV levels alone does not supply the vegas or premiums needed for a dollar sensitivity calculation.
For example, a column headed IV 30% cannot be added to a $100 strike or a $3 premium. The units differ. A worksheet that keeps dollar columns and percentage columns visibly separate makes that error easier to spot. This is a bookkeeping convention for the illustration, rather than a claim about which contract has more value.
Worked illustration: one hypothetical snapshot
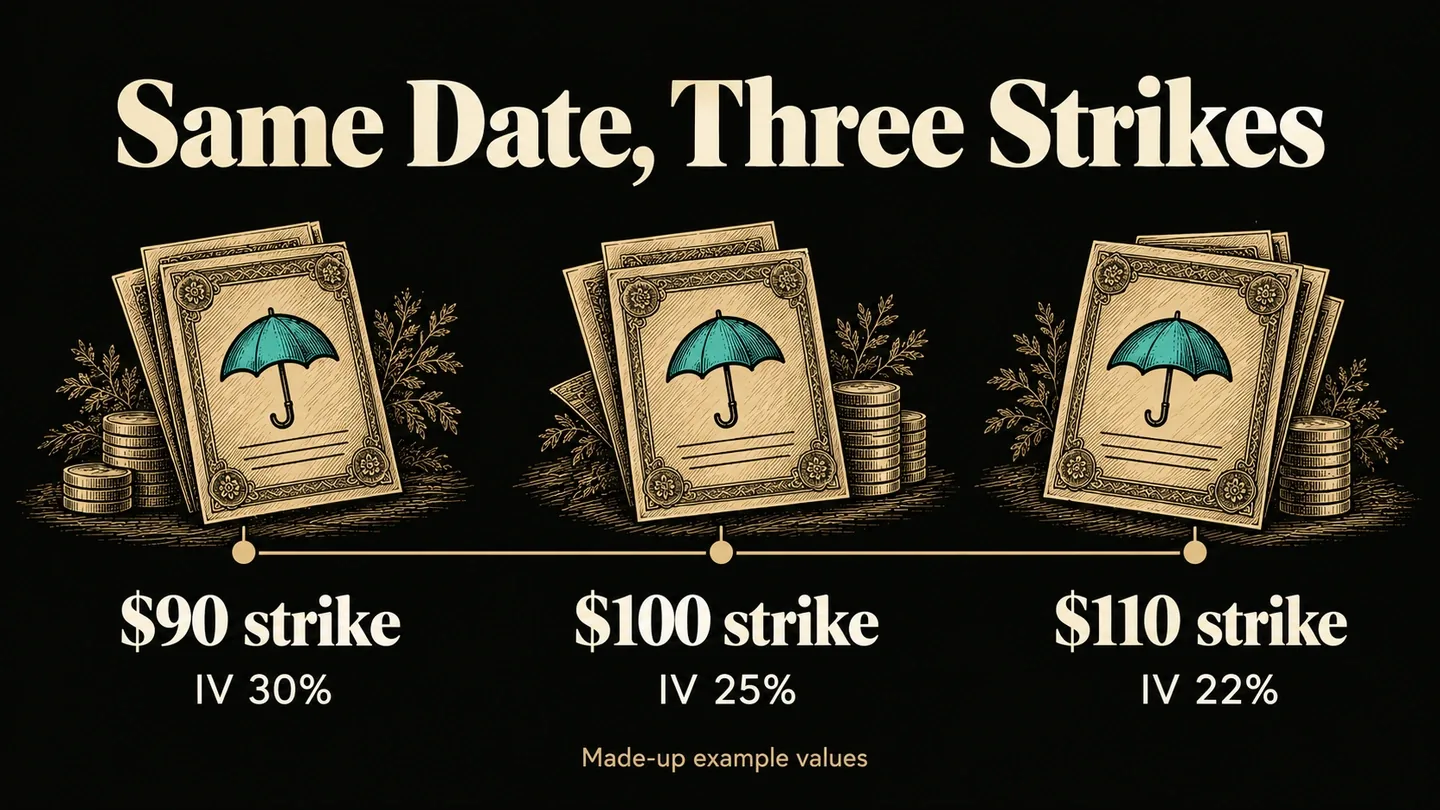
The following values are made-up illustrations, not quotes or estimates. Assume a hypothetical stock reference price of $100, a single expiration and a hypothetical IV reading of 30% at strike $90, 25% at strike $100 and 22% at strike $110. No premiums or option-pricing model are used. The table illustrates comparison units only.
| Strike | Hypothetical IV | Difference from 25% reference |
|---|---|---|
| $90 | 30% | +5 percentage points |
| $100 | 25% | 0 percentage points |
| $110 | 22% | -3 percentage points |
The lower-strike reading exceeds the middle reading by 30% - 25% = 5 percentage points. The middle exceeds the higher by 25% - 22% = 3 percentage points. Across the outside strikes, 30% - 22% = 8 percentage points. A second check adds the two adjacent differences: 5 + 3 = 8. This is the arithmetic shown in the table.
There is no expiration payoff chart here because no position has been specified. A list of IV readings does not identify a purchased or sold contract, its entry premium, its multiplier or the resulting profit formula. Adding a profit axis to this table would require inventing information that the illustration deliberately leaves unspecified.
Percentage points are not relative percentages
Compare 30% with 25%. The difference is 5 percentage points. The relative increase from a 25% baseline is (30 - 25) / 25 = 0.20, or 20%. Saying 5% higher would confuse these two calculations. The second cross-check multiplies the baseline by the relative increase: 25% × 20% = 5 percentage points; 25% + 5 percentage points = 30%.
The reference matters to the relative calculation. Moving from 30% down to 25% is a 5-percentage-point decrease, but its relative size is 5 / 30, about 16.67%. It is not a 20% relative decrease. This asymmetry comes from changing the denominator, rather than from anything special about options. A caption that identifies the baseline prevents readers from comparing unlike percentages.
The $10 spacing between adjacent strikes, and the $20 gap between the two outside strikes, are another separate unit. Dividing the 8-percentage-point difference between the outside strikes by the $20 gap would produce an average slope in percentage points per dollar of strike. This guide does not turn that slope into a universal skew measure. It only shows why a comparison must identify both the values and the scale used.
Smile, smirk and a flat comparison
For another made-up comparison, keep the same three strikes and expiration but replace the readings with 30%, 25% and 30%. Both outside readings now stand 5 percentage points above the middle. If all three readings were 25%, the differences would all be zero. These alternative tables change the hypothetical input values; they are not observed changes through time.
| Illustrated pattern | Lower strike IV | Middle strike IV | Higher strike IV |
|---|---|---|---|
| Higher on the lower-strike side (smirk-like) | 30% | 25% | 22% |
| Both elevated wings | 30% | 25% | 30% |
| Flat comparison | 25% | 25% | 25% |
The names summarize a shape. They do not establish an entry price, an eventual stock direction or a reason to choose a particular strategy. Even in these simple examples, the same middle reading appears in all three patterns. One at-the-money number therefore cannot reproduce the entire list of readings. A reader who records only 25% has lost the information in the other two columns.
The option chain lesson introduces contract identifiers and quote fields. The glossary definition of moneyness helps identify which side of the reference price a strike occupies. These links support reading the inputs; neither converts the hypothetical shape into an expected return.
The other meaning: statistical skewness
In statistics, NIST’s explanation of skewness describes asymmetry in a distribution. Positive and negative values concern the relative tails. That is a different measurement from a strike-by-strike list of option IVs. A return-distribution skewness estimate and an option skew snapshot may both be called skew, so a clear description must identify which object is being measured.
A simple labelling habit resolves much of the ambiguity. A table headed strike and implied volatility is describing an option-price comparison. A table headed observations and frequency is describing a data distribution. The labels alone do not prove that either analysis is complete, but they tell a reader what the numbers purport to represent. This article’s worked numbers belong to the first kind only.
No return sample, observation period or statistical coefficient has been calculated here. The 8-percentage-point gap is not a statistical skewness estimate. It is also not a percentage chance that the stock falls. Keeping that boundary explicit avoids presenting the same small set of made-up numbers as evidence for several unrelated conclusions.
Limits and a repeatable practice record
The OIC pricing overview lists multiple inputs to option prices. A comparison that changes several inputs cannot isolate the effect of IV alone. This article therefore avoids turning the hypothetical IV table into invented premiums. It also makes no claim that a higher IV number necessarily means a higher dollar premium across different strikes.
An educational record can store the underlying identifier, expiration, snapshot time, strike, option type and IV reading as separate fields. It can then state its comparison convention and denominator. The trade journal lesson and free journal template provide related recordkeeping resources. The example’s missing market inputs remain marked as missing.
Skew analysis does not remove premium loss, assignment exposure, margin requirements, liquidity constraints or transaction costs from any position built afterward. Those depend on the contracts and account involved. This guide selects no position, supplies no executable quotes and offers no tax treatment. For taxes, ask a tax professional. Its finished output is a checked comparison, rather than a recommendation.
Questions people ask
Does 30% IV mean a 30% chance of a decline?
No. This illustration uses IV as a pricing input. It provides no event probability calculation.
What is the gap from 30% to 25%?
It is 5 percentage points. Relative to 25%, 30% is 20% higher; that is a different unit.
Why hold expiration fixed?
That defines this strike-by-strike comparison. Comparing different expirations would add a second dimension rather than isolate the same slice.
Is options skew the same as statistical skewness?
No. The former compares option IV across strikes; the latter describes distribution asymmetry.
Sources
Educational content only, not investment advice. Trading options involves risk, including the loss of your entire investment in a position.