
Strategies · October 31, 2026 · 9 min read
Bull Call Spread: How It Works, With a Worked Example
By Gerson Yoss
A bull call spread pairs a purchased call at a lower strike with a call sold at a higher strike, both with the same expiration. It costs a net debit and has a capped theoretical expiration profit.
This guide explains the structure through invented prices and a calculated payoff chart. It is education only, not trading advice. Strategy explanations follow the Options Industry Council’s bull call spread page.
The short version
- Buy the lower-strike call and sell the higher-strike call with the same expiration.
- Maximum loss is the net debit; maximum profit is strike width minus debit, before costs.
- Breakeven at expiration is the purchased call’s strike plus the net debit.
- Assignment and expiration can leave stock exposure that the simple payoff chart does not describe.
The two calls and their different jobs

The Options Industry Council describes a bull call spread as a vertical spread: two calls on the same underlying stock, with the same expiration and different strike prices. The purchased call has the lower strike. The sold call has the higher strike. The word vertical describes the arrangement of strikes, rather than a forecast about how far a stock will move.
The strike is the contract’s exercise price. In this structure, the lower-strike call supplies the purchased exposure. The premium received from selling the higher-strike call helps pay for it. The difference between the premium paid and the premium received is the net debit, or the initial amount paid for the pair. Our debit spread glossary entry provides a companion definition.
The short call does two jobs at once: it reduces the initial cost and limits the eventual upside. Looking only at the cheaper entry misses half the structure. The spread gives up additional gains beyond its upper strike in exchange for that cost reduction. The vertical spreads lesson places this arrangement alongside other two-leg spreads.
Reading the structure without making a prediction
OIC classifies the strategy with a steady or rising stock-price outlook. That describes its directional exposure; it does not establish what any stock will do. In the expiration calculation, a sufficiently high closing price produces a profit, while a price below the lower strike produces a loss. The paid debit means that a small rise alone need not produce a profit.
A spread also has an expiration date. A view about an eventual rise, without regard to timing, does not answer the question this position poses. The stock price at expiration determines the terminal payoff in the example below. Before expiration, the position has option prices rather than just its final exercise values. Those are different measurements.
The example deliberately uses an unnamed stock and invented premiums. It is an illustration of a contract structure, not a proposed trade. No stock selection, target, entry recommendation or probability estimate is implied. The call mechanics lesson provides background on the purchased and sold components.
One worked example: an illustration
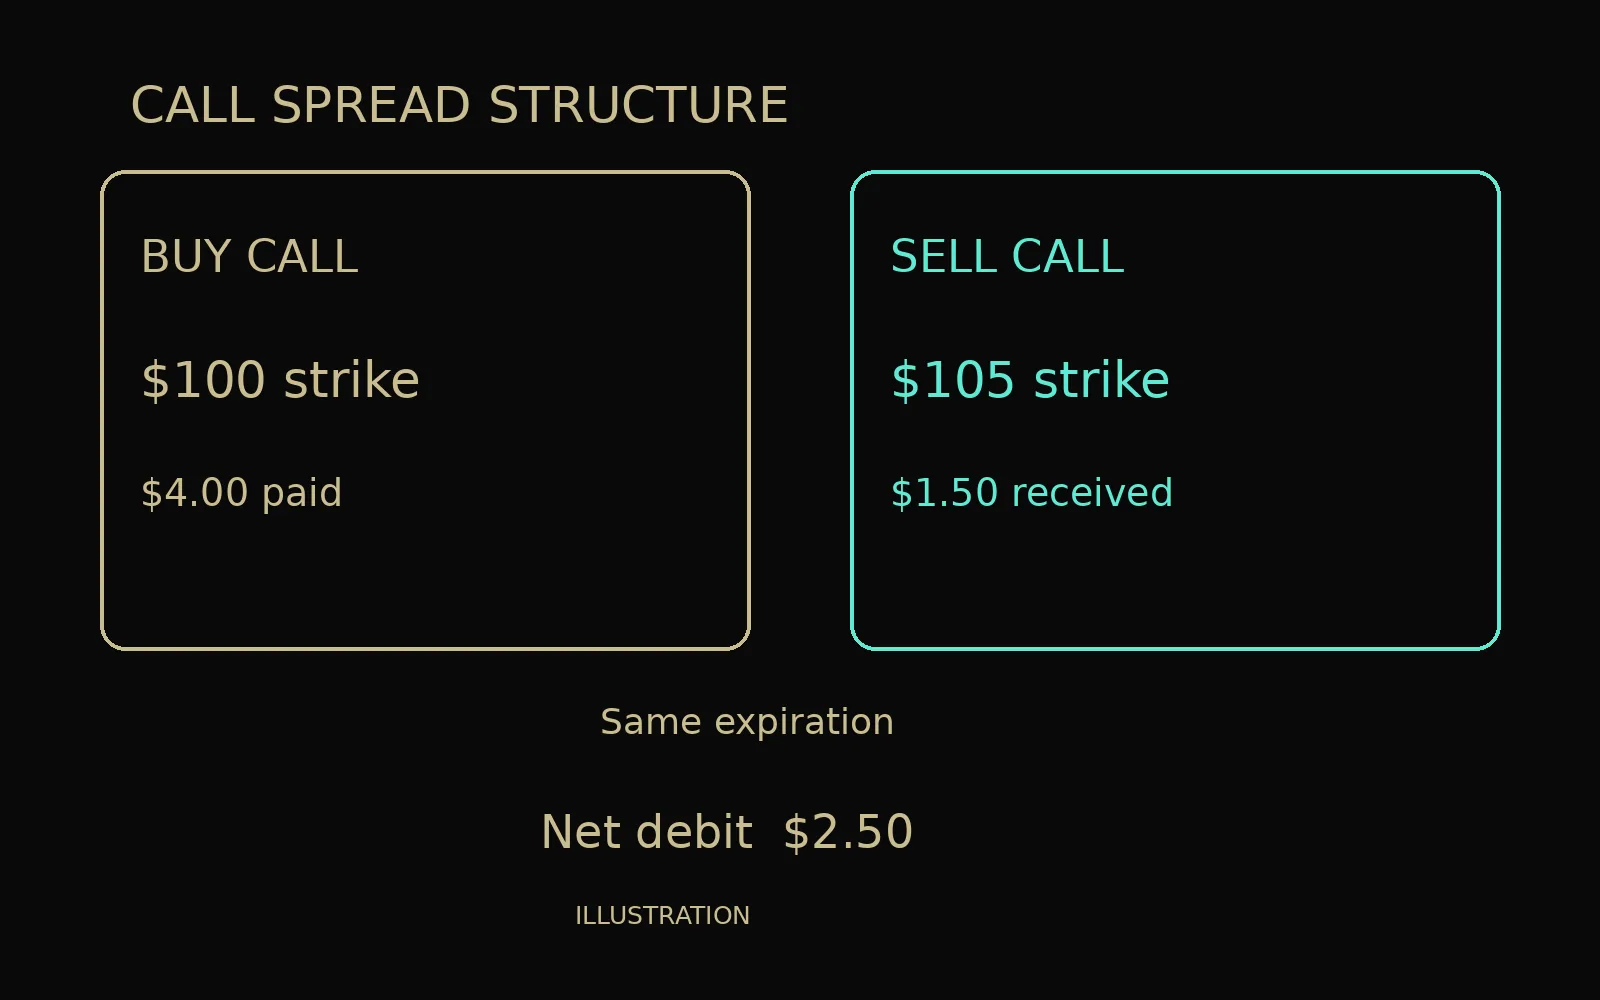
Illustration only: assume an unnamed stock is at $100. Buy one call with a $100 strike for $4.00 per share, and sell one call with a $105 strike for $1.50 per share. Both calls have the same expiration. For this illustration, each contract represents 100 shares. These prices are made up, not market quotes. All calculations exclude commissions, fees and taxes.
| Component | Per share | For the 100-share illustration |
|---|---|---|
| Buy the $100 call | $4.00 paid | $400 paid |
| Sell the $105 call | $1.50 received | $150 received |
| Net debit | $4.00 − $1.50 = $2.50 | $400 − $150 = $250 |
| Strike width | $105 − $100 = $5.00 | $500 |
Maximum loss is the $2.50 net debit multiplied by 100, or $250. Maximum profit is the $5.00 strike width minus the $2.50 debit, multiplied by 100: ($5.00 − $2.50) × 100 = $250. Breakeven at expiration is the $100 long-call strike plus the $2.50 debit, or $102.50. These follow OIC’s maximum-loss, maximum-gain and breakeven formulas.
A second calculation checks the same results using cash flows. The position costs $400 − $150 = $250. Its largest expiration exercise-value difference is $500, leaving $500 − $250 = $250 profit. With no expiration exercise value, the original $250 outlay is lost. At $102.50, the long call contributes $250 and the short call contributes zero, exactly offsetting the initial outlay.
Following the payoff through expiration
For the illustration, calculate the long call’s expiration value as the amount the stock price exceeds $100, with a minimum of zero. Subtract the amount it exceeds $105 for the short call, also with a minimum of zero. Then subtract the $2.50 debit and multiply by 100. This independently reproduces the spread’s expiration profit or loss.
| Stock at expiration | Long call value per share | Short call value per share | Net profit or loss |
|---|---|---|---|
| $95 | $0 | $0 | −$250 |
| $100 | $0 | $0 | −$250 |
| $102 | $2 | $0 | −$50 |
| $102.50 | $2.50 | $0 | $0 |
| $104 | $4 | $0 | +$150 |
| $105 | $5 | $0 | +$250 |
| $110 | $10 | $5 | +$250 |
The last two rows show why the profit stops growing. At $110, the long call is worth $10 per share, but the short call offsets $5 per share. Their difference is still $5. Subtracting the original $2.50 debit leaves $2.50 per share, or $250. A larger stock increase does not enlarge this theoretical expiration profit.
Time and volatility before expiration
OIC describes time passage as generally harmful to the position, though less harmful than for a single purchased call. One call is purchased and another is sold with the same expiration, so some of their time-decay effects can offset. That does not mean the deadline disappears. The debit is an initial cost, and expiration remains the endpoint for the illustrated payoff.
OIC describes the effect of volatility changes as slight, with other things equal, because the effects on the two calls can largely offset. It also warns that stock-price changes can cause volatility to affect one call more than the other. Treating the pair as completely insensitive to volatility would therefore go beyond the source.
The chart above is an expiration diagram. It is not a forecast of the spread’s resale price on an earlier date. Its straight segments come from exercise values and the invented debit. The expiration-date glossary entry helps distinguish the contract deadline from the period during which the options still exist.
Assignment and expiration deserve separate attention
The short call introduces assignment risk. OIC states that early assignment is possible and highlights ex-dividend timing as a usual setting for it. Its discussion also identifies corporate events, including mergers, spin-offs and special dividends, as situations that can upset ordinary expectations about early exercise. This article does not assign a numerical probability to those events.
OIC warns that notification timing can leave a stock position between assignment and the use of the long call to address it. The expiration spread diagram should not be read as a picture of every possible stock position during that process. The original pair and a position left after an exercise or assignment are different situations.
Near the short strike at expiration, the outcome of assignment can be uncertain. OIC explains that expecting a stock sale that does not happen can leave stock owned, while separately selling shares and also being assigned can leave a short stock position. Those stock positions introduce exposure beyond simply watching two options expire. The assignment and expiration lesson is relevant background.
Comparing the call spread with the bear-put article
Readers arriving from Bear Put Spread: How It Works, With a Worked Example can use this article as the call-side comparison. Begin with the same questions: which option is purchased, which is sold, what debit is paid, and where does the payoff stop changing? Here the lower-strike call is purchased and the higher-strike call is sold.
The bull-call formulas give a useful comparison framework without treating the two articles as interchangeable instructions. Read the example’s direction from its own table: the illustrated call spread reaches its higher payoff at higher stock prices. Its long strike plus debit determines its breakeven. Copying another strategy’s breakeven expression without checking the contract type would produce the wrong answer.
The comparison starts with the payoff table rather than a label alone. In this call-spread illustration, $100 and below produces the full debit loss; $105 and above produces the capped profit. Between those strikes, each additional dollar of stock price changes the illustrated spread payoff by $100. At $102.50, the original debit has just been recovered before costs.
Practice notes and limits of this guide
A practice record can separate the original debit, each strike, the shared expiration, the payoff arithmetic and any unanswered operational questions. Academia Trade has a free trading journal template. The arithmetic can be reviewed without selecting a real stock or assuming a future market outcome.
To check the arithmetic with your own strikes and premiums, the free options profit calculator shows the breakeven, the maximum profit and the maximum loss of a bull call spread at expiration.
Every lesson in the options course is free to read, in English and Spanish. This blog article is in English. Neither this practice pointer nor the example claims that the simulator supports a particular multi-leg order workflow. That feature is not established by the supplied product information.
The OIC strategy page does not establish a particular broker’s margin or buying-power treatment, an executable bid-ask spread, available liquidity, transaction charges or personal tax treatment. Those items are outside the calculation here. For taxes, ask a tax professional. This is education only, not a recommendation, prediction or assessment of whether the strategy suits a particular person.
Questions people ask
What is the maximum loss on the illustrated bull call spread?
The paired expiration payoff loses the $2.50-per-share debit at most: $2.50 × 100 = $250, excluding costs. OIC identifies the net premium paid as maximum loss. Stock exposure after exercise or assignment needs separate consideration.
Where is breakeven in the example?
At expiration, $100 plus the $2.50 debit equals $102.50. The long call’s $2.50-per-share exercise value offsets the debit while the short call has zero exercise value.
Why does the example stop gaining above $105?
Above $105, additional expiration value in the purchased call is offset by additional value owed on the sold call. The $5 strike difference minus the $2.50 debit leaves $2.50 per share, or $250 for the illustrated spread.
Can the short call be assigned before expiration?
Yes. OIC discusses early assignment and highlights ex-dividend timing and corporate events. It also describes expiration uncertainty near the short strike. The payoff diagram is not a substitute for understanding the resulting stock positions.
Sources
Educational content only, not investment advice. Trading options involves risk, including the loss of your entire investment in a position.