
Daily chart analysis · October 23, 2026
AT&T Inc. (T) stock analysis: October 23, 2026
Intraday snapshot, Fri Oct 23, 2026 at 11:08 AM (UTC-7). Not a closing price.
Educational content only, not investment advice. Chart readings are snapshots taken at the time shown, not closing prices, and nothing here predicts where a stock will go.
Why T today
AT&T fell about 6.6% on Friday after Bloomberg reported that SpaceX is in talks for access to at least 80,000 U.S. cell sites, a step toward the fourth nationwide wireless carrier it has been building. T-Mobile and Verizon dropped as well, while tower companies such as Crown Castle jumped. The talks are not confirmed. It comes two days after AT&T's Q3 report (adjusted EPS $0.65 vs $0.60 expected, revenue up 5.3% to $32.3B, 2026 EPS outlook raised to about $2.40), where a small miss on postpaid phone additions and higher net debt had already weighed on the shares.
Technical view
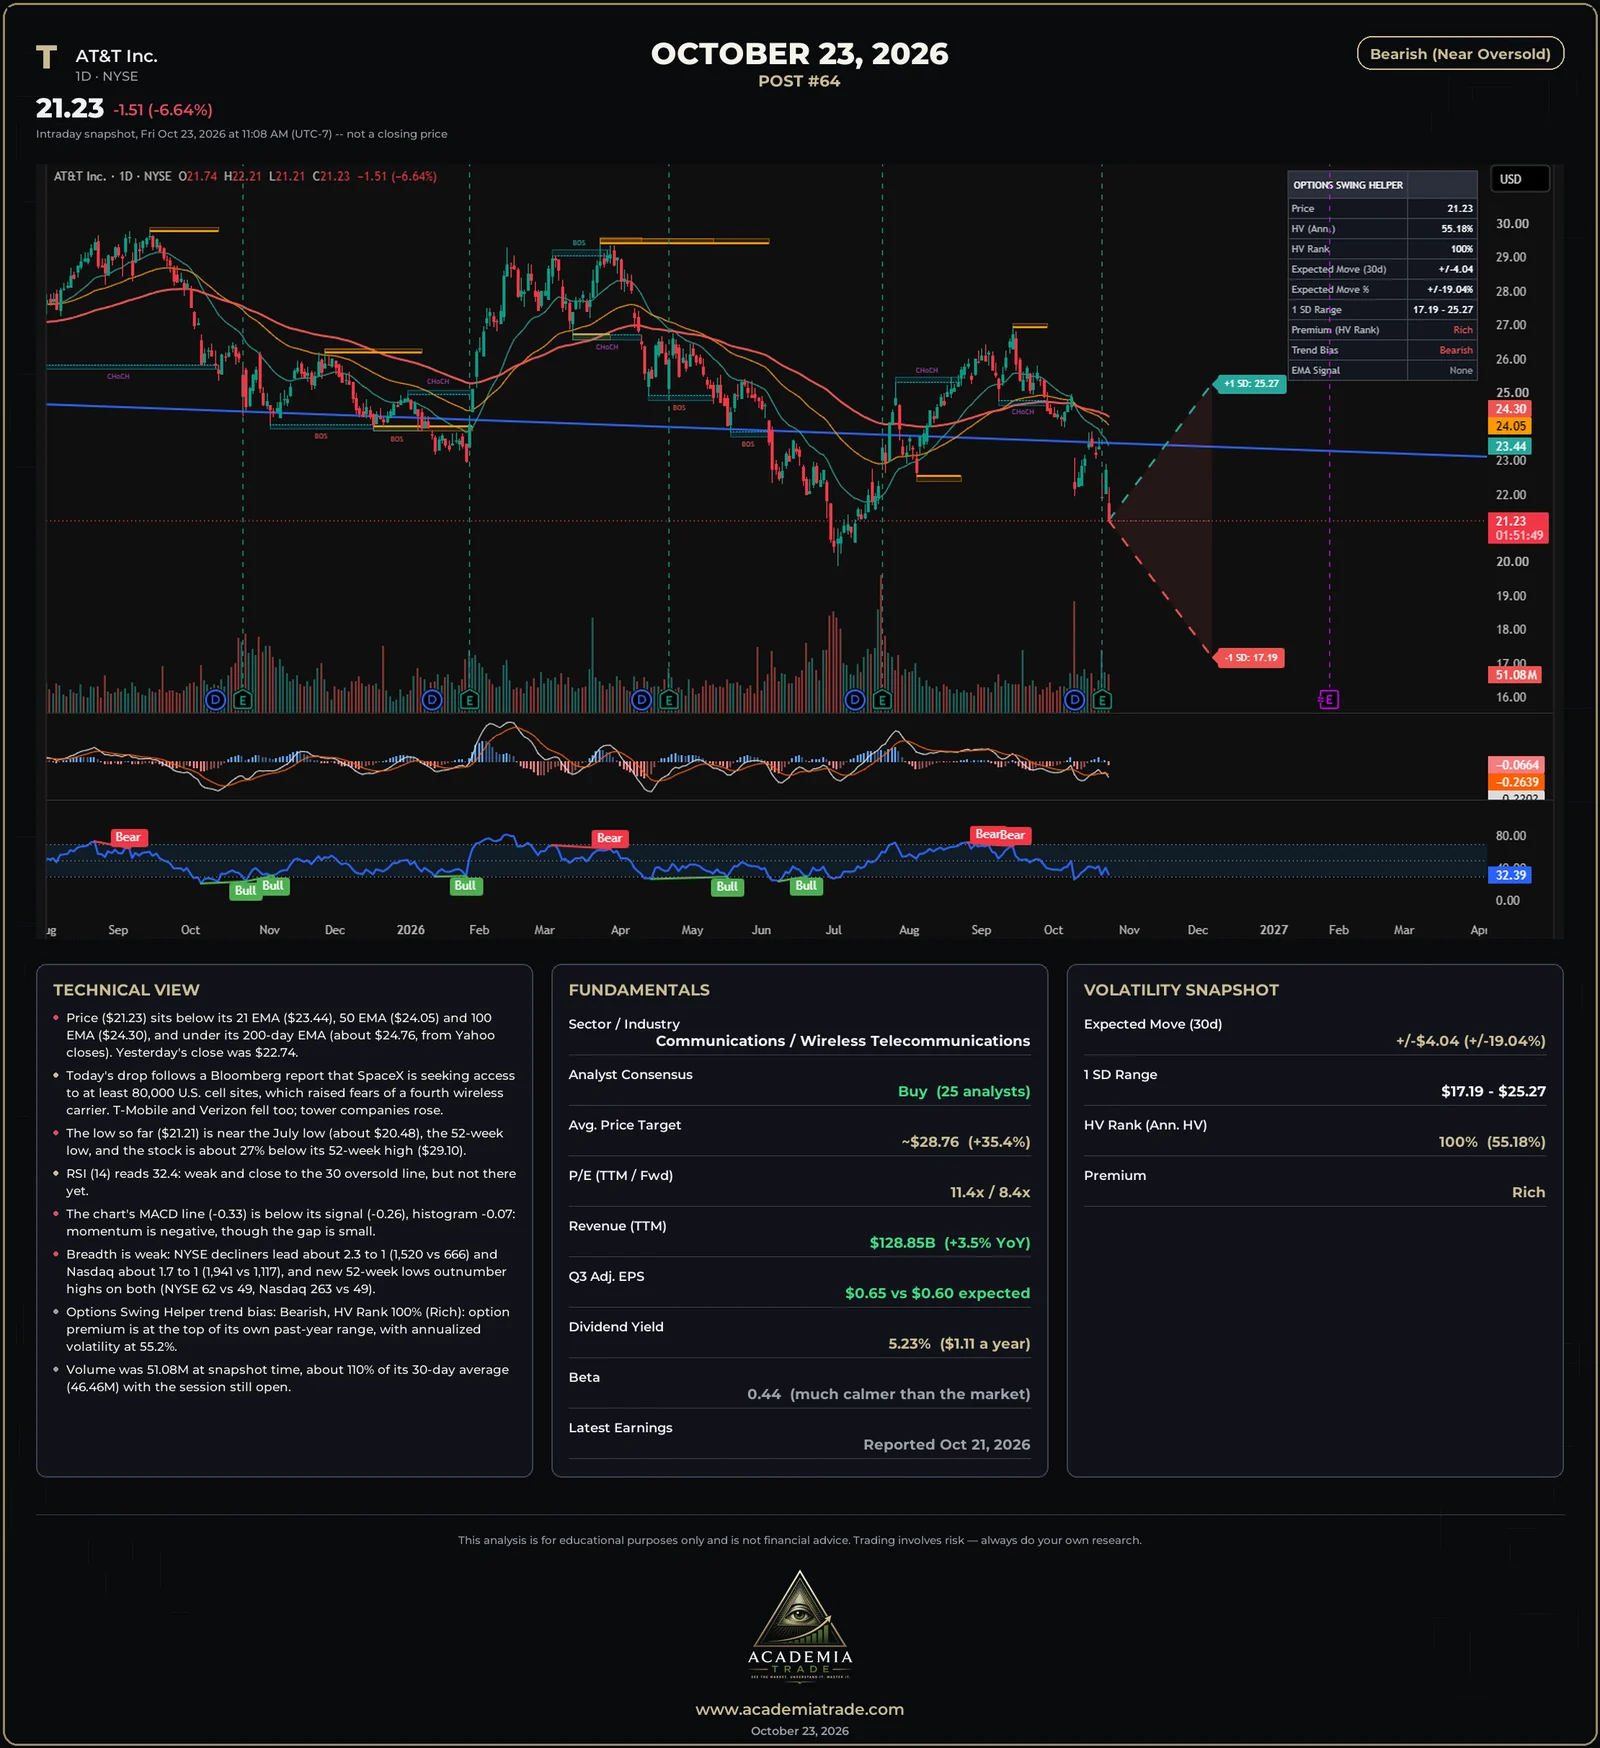
- Price ($21.23) sits below its 21 EMA ($23.44), 50 EMA ($24.05) and 100 EMA ($24.30), and under its 200-day EMA (about $24.76, from daily closes). Yesterday's close was $22.74.
- Today's drop follows a Bloomberg report that SpaceX is seeking access to at least 80,000 U.S. cell sites, which raised fears of a fourth wireless carrier. T-Mobile and Verizon fell too; tower companies rose.
- The low so far ($21.21) is near the July low (about $20.48), the 52-week low, and the stock is about 27% below its 52-week high ($29.10).
- RSI (14) reads 32.4: weak and close to the 30 oversold line, but not there yet.
- The chart's MACD line (-0.33) is below its signal (-0.26), histogram -0.07: momentum is negative, though the gap is small.
- Breadth is weak: NYSE decliners lead about 2.3 to 1 (1,520 vs 666) and Nasdaq about 1.7 to 1 (1,941 vs 1,117), and new 52-week lows outnumber highs on both (NYSE 62 vs 49, Nasdaq 263 vs 49).
- Options Swing Helper trend bias: Bearish, HV Rank 100% (Rich): option premium is at the top of its own past-year range, with annualized volatility at 55.2%.
- Volume was 51.08M at snapshot time, about 110% of its 30-day average (46.46M) with the session still open.
Market breadth and new highs / lows
- NYSE: 666 advancers vs 1,520 decliners, about 2.3 to 1 negative. Nasdaq: 1,117 vs 1,941, about 1.7 to 1 negative.
- About 58% of S&P 500 stocks were above their 50-day average and 56% above their 200-day (Barchart): participation is a little better than half the index.
- New 52-week highs vs lows (Barchart, about 2:00 PM ET): NYSE 49 vs 62, Nasdaq 49 vs 263, so lows lead on both exchanges.
Fundamentals
- Sector / Industry
- Communications / Wireless Telecommunications
- Analyst Consensus
- Buy (25 analysts)
- Avg. Price Target
- ~$28.76 (+35.4%)
- P/E (TTM / Fwd)
- 11.4x / 8.4x
- Revenue (TTM)
- $128.85B (+3.5% YoY)
- Q3 Adj. EPS
- $0.65 vs $0.60 expected
- Dividend Yield
- 5.23% ($1.11 a year)
- Beta
- 0.44 (much calmer than the market)
- Latest Earnings
- Reported Oct 21, 2026
Volatility snapshot (Options Swing Helper)
- Expected Move (30d)
- ±$4.04 (±19.04%)
- 1 SD Range
- $17.19 - $25.27
- HV Rank (Ann. HV)
- 100% (55.18%)
- Premium
- Rich
The expected move and 1 SD range come from the Options Swing Helper indicator on the chart; they describe how far the market is pricing the stock to move over 30 days, not where it will go.
Our read: Bearish (Near Oversold)
The reading leans negative but is stretched. Price is under all four moving averages and the chart's MACD is below its signal, and the market is reacting to a competitive worry rather than to AT&T's own numbers, which beat on earnings and raised the outlook. RSI is near 30, option premium is at the top of its range, and the stock trades at about 8.4x forward earnings with a 5% dividend yield. The main thing to watch is whether it holds the July low, around $20.50.
Not investment advice, illustrative and educational only.
Learn how to read this
- Options Swing Helper : the free TradingView indicator behind the expected-move cone and HV Rank
- Free options lessons : contracts, the Greeks, income strategies and volatility
- Bullish, bearish and VIX : terms used in these reports
- Signal Desk : research any stock and practice with a paper-trading account