
Daily chart analysis · October 22, 2026
Meta Platforms, Inc. (META) stock analysis: October 22, 2026
Intraday snapshot, Thu Oct 22, 2026 at 11:17 AM (UTC-7). Not a closing price.
Educational content only, not investment advice. Chart readings are snapshots taken at the time shown, not closing prices, and nothing here predicts where a stock will go.
Why META today
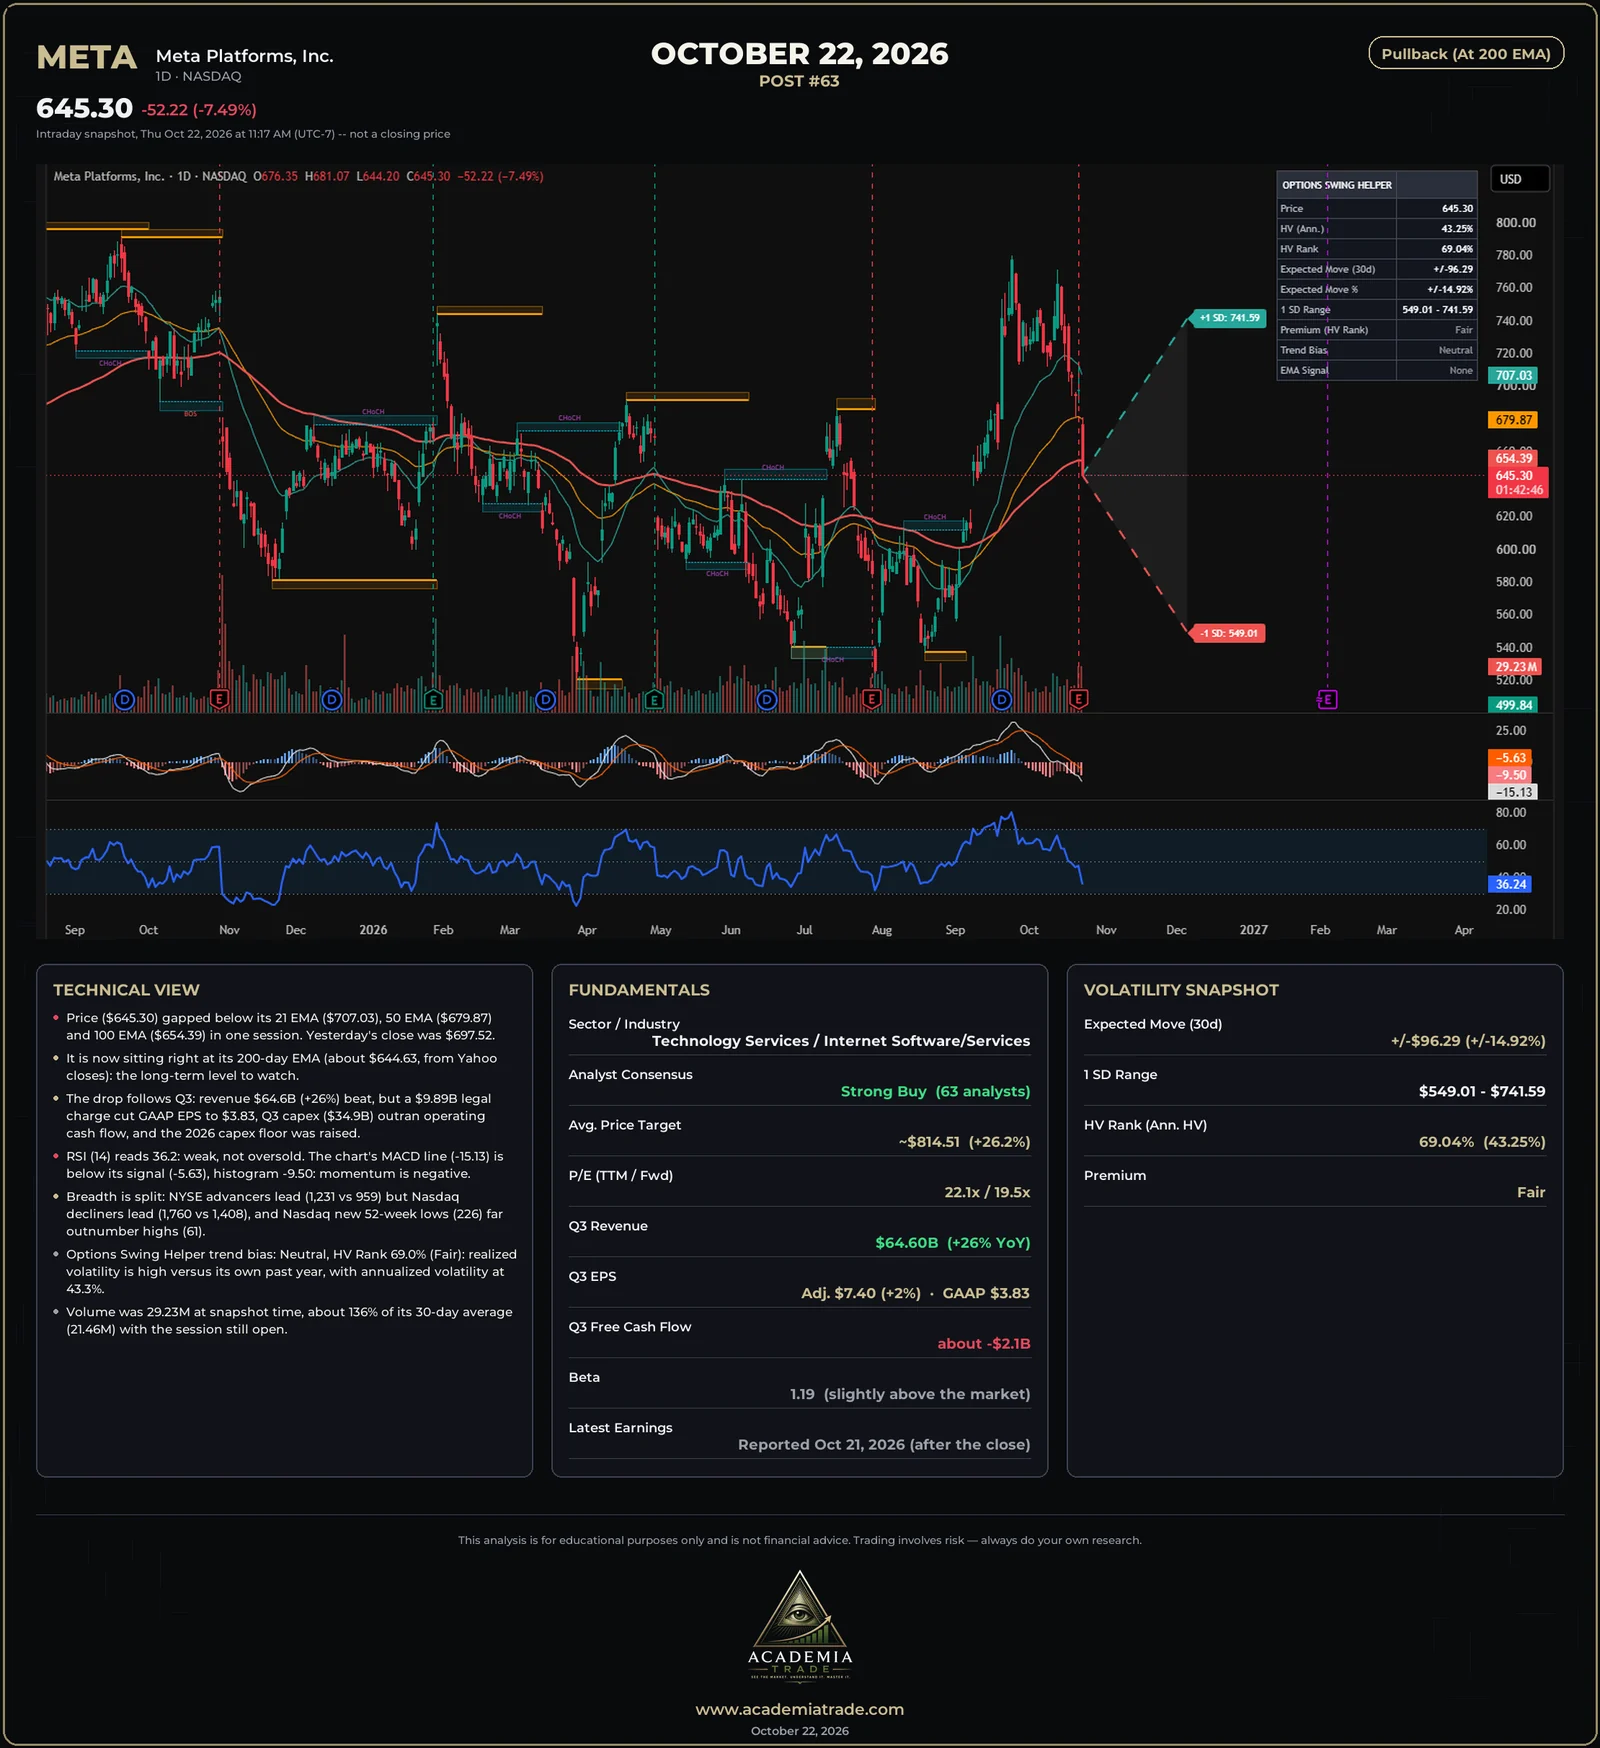
Meta reported Q3 2026 after Wednesday's close. Revenue rose 26% to $64.60B, beating the ~$63.3B consensus, and Q4 revenue guidance came in at $73B-$76B. But a $9.89B legal settlement charge cut GAAP EPS to $3.83 (adjusted $7.40), Q3 capex of $34.9B outran $32.8B of operating cash flow, the low end of 2026 capex guidance rose to $135B-$145B, and a new non-voting Class C share class raised dilution worries. Shares fell about 7.5% on roughly 1.4 times their usual volume.
Technical view
- Price ($645.30) gapped below its 21 EMA ($707.03), 50 EMA ($679.87) and 100 EMA ($654.39) in one session. Yesterday's close was $697.52.
- It is now sitting right at its 200-day EMA (about $644.63, from daily closes): the long-term level to watch.
- The drop follows Q3: revenue $64.6B (+26%) beat, but a $9.89B legal charge cut GAAP EPS to $3.83, Q3 capex ($34.9B) outran operating cash flow, and the 2026 capex floor was raised.
- RSI (14) reads 36.2: weak, not oversold. The chart's MACD line (-15.13) is below its signal (-5.63), histogram -9.50: momentum is negative.
- Breadth is split: NYSE advancers lead (1,231 vs 959) but Nasdaq decliners lead (1,760 vs 1,408), and Nasdaq new 52-week lows (226) far outnumber highs (61).
- Options Swing Helper trend bias: Neutral, HV Rank 69.0% (Fair): realized volatility is high versus its own past year, with annualized volatility at 43.3%.
- Volume was 29.23M at snapshot time, about 136% of its 30-day average (21.46M) with the session still open.
Market breadth and new highs / lows
- NYSE: 1,231 advancers vs 959 decliners, about 1.3 to 1 positive. Nasdaq: 1,408 vs 1,760, about 1.25 to 1 negative.
- About 55% of S&P 500 stocks were above their 50-day average and 55% above their 200-day at Wednesday's close: participation is middling.
- New 52-week highs vs lows (Barchart, about 2:07 PM ET): NYSE 82 vs 60, but Nasdaq 61 vs 226, as tech leads the decline.
Fundamentals
- Sector / Industry
- Technology Services / Internet Software/Services
- Analyst Consensus
- Strong Buy (63 analysts)
- Avg. Price Target
- ~$814.51 (+26.2%)
- P/E (TTM / Fwd)
- 22.1x / 19.5x
- Q3 Revenue
- $64.60B (+26% YoY)
- Q3 EPS
- Adj. $7.40 (+2%) · GAAP $3.83
- Q3 Free Cash Flow
- about -$2.1B
- Beta
- 1.19 (slightly above the market)
- Latest Earnings
- Reported Oct 21, 2026 (after the close)
Volatility snapshot (Options Swing Helper)
- Expected Move (30d)
- ±$96.29 (±14.92%)
- 1 SD Range
- $549.01 - $741.59
- HV Rank (Ann. HV)
- 69.04% (43.25%)
- Premium
- Fair
The expected move and 1 SD range come from the Options Swing Helper indicator on the chart; they describe how far the market is pricing the stock to move over 30 days, not where it will go.
Our read: Pullback (At 200 EMA)
The reading is mixed. The chart turned against the stock in one session: a gap below the 21, 50 and 100 EMAs, RSI near 36 and the chart's MACD below its signal, with weak Nasdaq breadth around it. The business numbers are not the problem the market is reacting to: revenue grew 26% and Q4 guidance is higher. The concern is the cost of that growth: a large legal charge, capex above operating cash flow and a higher spending plan. Price is now sitting on its 200-day EMA, so whether that level holds is the main thing to watch.
Not investment advice, illustrative and educational only.
Learn how to read this
- Options Swing Helper : the free TradingView indicator behind the expected-move cone and HV Rank
- Free options lessons : contracts, the Greeks, income strategies and volatility
- Bullish, bearish and VIX : terms used in these reports
- Signal Desk : research any stock and practice with a paper-trading account