
Daily chart analysis · October 21, 2026
Netflix, Inc. (NFLX) stock analysis: October 21, 2026
Intraday snapshot, Wed Oct 21, 2026 at 12:01 PM (UTC-7). Not a closing price.
Educational content only, not investment advice. Chart readings are snapshots taken at the time shown, not closing prices, and nothing here predicts where a stock will go.
Why NFLX today
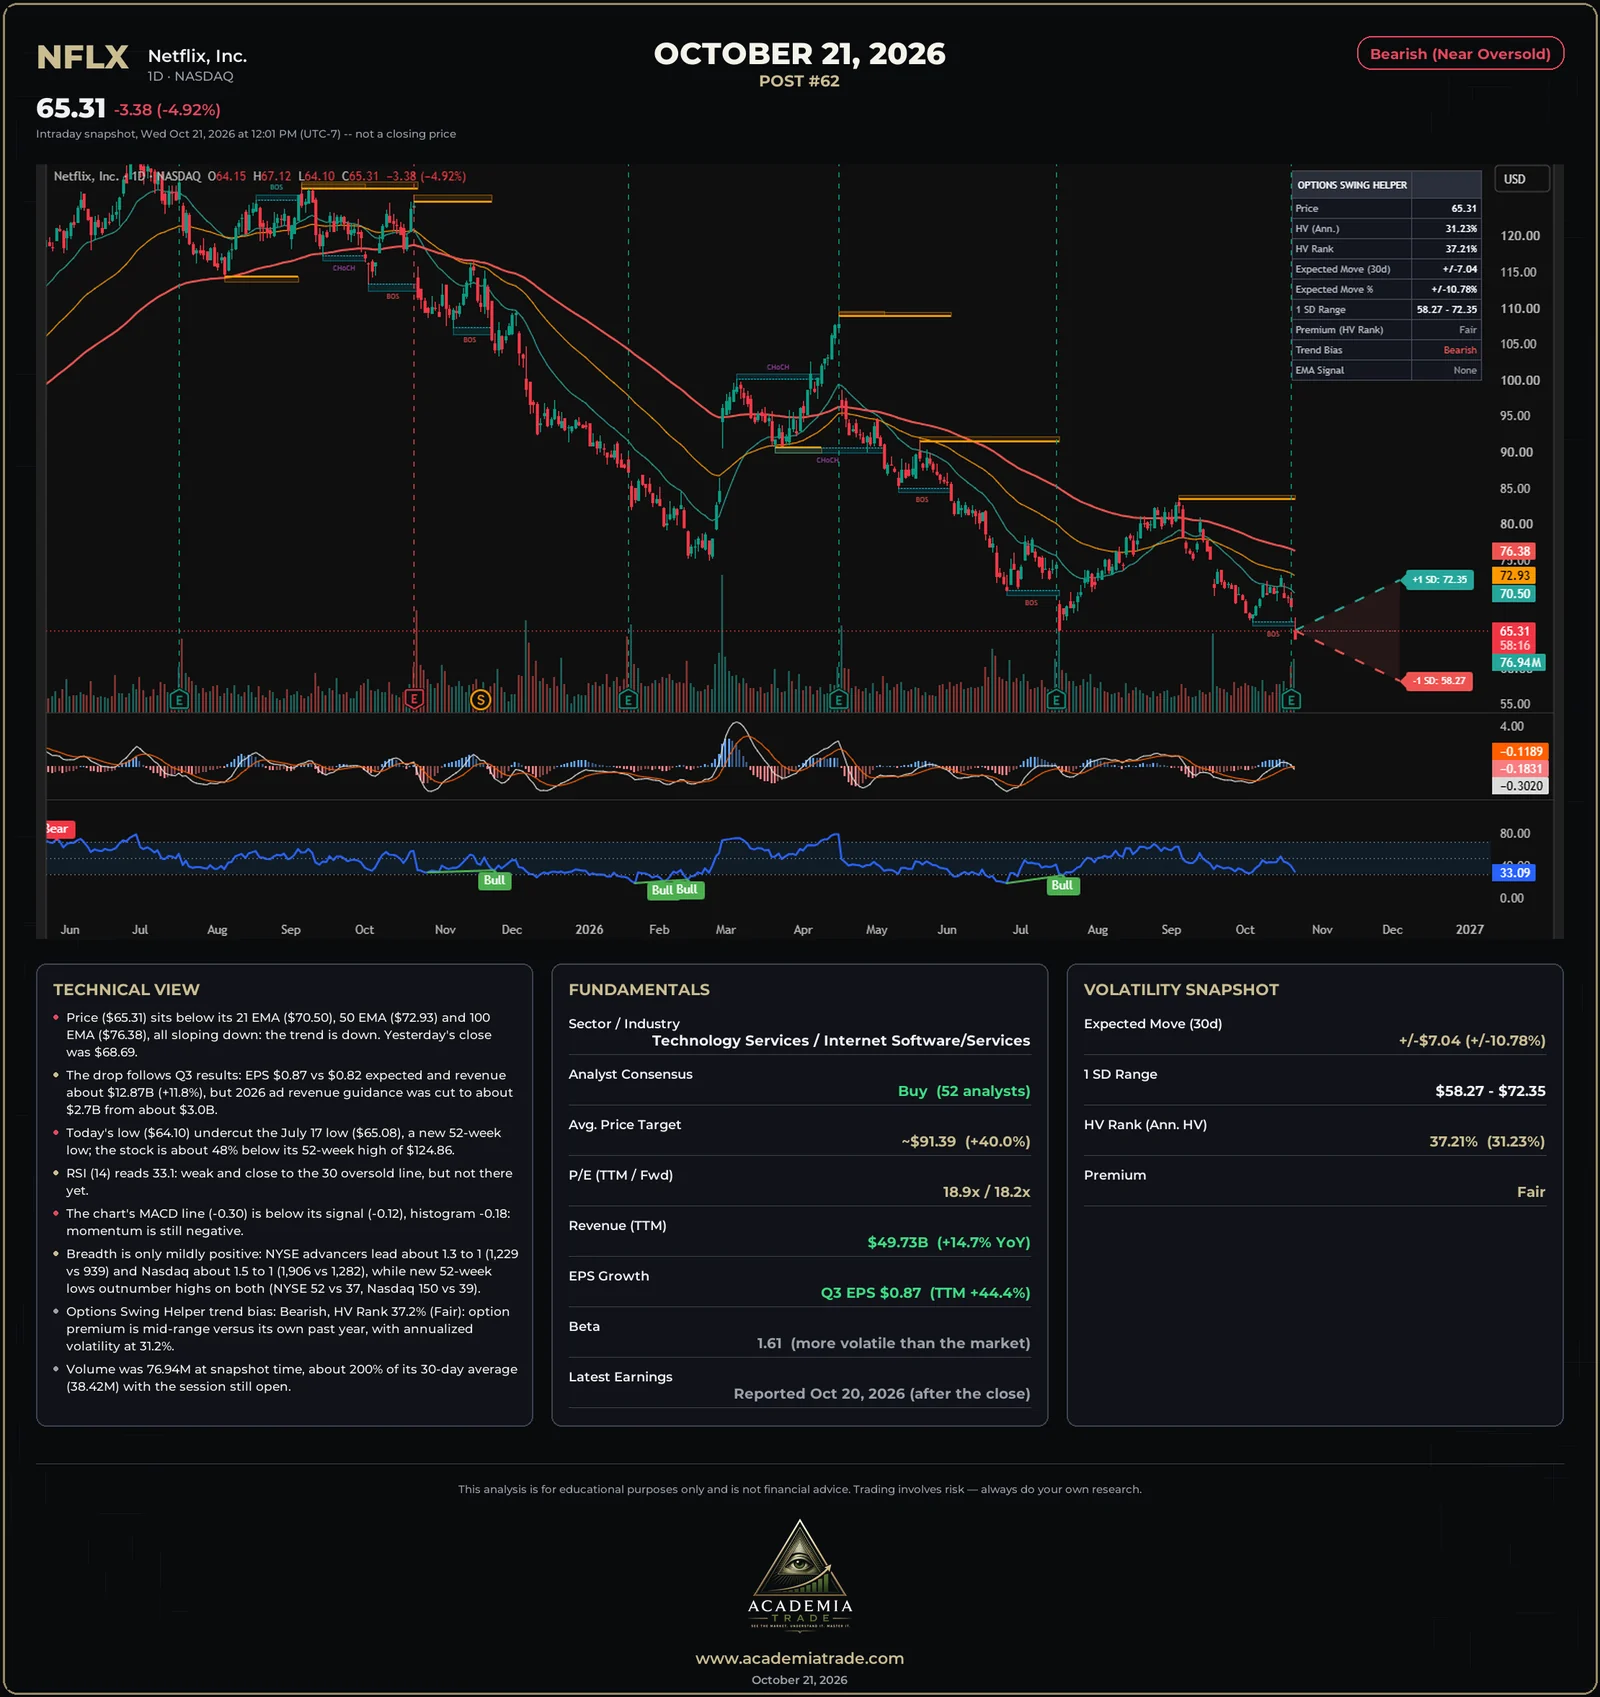
Netflix beat Q3 estimates (EPS $0.87 vs $0.82 expected, revenue about $12.87B, up 11.8%, operating margin 34.6%) but cut its 2026 advertising revenue forecast to about $2.7B from about $3.0B, citing a slower-than-expected rollout of some ad product capabilities. It reaffirmed full-year 2026 revenue guidance of about $51.1B. Shares fell about 4.9% on roughly twice their usual volume and touched a new 52-week low.
Technical view
- Price ($65.31) sits below its 21 EMA ($70.50), 50 EMA ($72.93) and 100 EMA ($76.38), all sloping down: the trend is down. Yesterday's close was $68.69.
- The drop follows Q3 results: EPS $0.87 vs $0.82 expected and revenue about $12.87B (+11.8%), but 2026 ad revenue guidance was cut to about $2.7B from about $3.0B.
- Today's low ($64.10) undercut the July 17 low ($65.08), a new 52-week low; the stock is about 48% below its 52-week high of $124.86.
- RSI (14) reads 33.1: weak and close to the 30 oversold line, but not there yet.
- The chart's MACD line (-0.30) is below its signal (-0.12), histogram -0.18: momentum is still negative.
- Breadth is only mildly positive: NYSE advancers lead about 1.3 to 1 (1,229 vs 939) and Nasdaq about 1.5 to 1 (1,906 vs 1,282), while new 52-week lows outnumber highs on both (NYSE 52 vs 37, Nasdaq 150 vs 39).
- Options Swing Helper trend bias: Bearish, HV Rank 37.2% (Fair): option premium is mid-range versus its own past year, with annualized volatility at 31.2%.
- Volume was 76.94M at snapshot time, about 200% of its 30-day average (38.42M) with the session still open.
Market breadth and new highs / lows
- NYSE: 1,229 advancers vs 939 decliners, about 1.3 to 1 positive. Nasdaq: 1,906 vs 1,282, about 1.5 to 1.
- About 57% of S&P 500 stocks were above their 50-day average and 55% above their 200-day (Barchart): participation is a little better than half the index.
- New 52-week highs vs lows (Barchart, about 2:51 PM ET): NYSE 37 vs 52, Nasdaq 39 vs 150, so lows still lead on both exchanges.
Fundamentals
- Sector / Industry
- Technology Services / Internet Software/Services
- Analyst Consensus
- Buy (52 analysts)
- Avg. Price Target
- ~$91.39 (+40.0%)
- P/E (TTM / Fwd)
- 18.9x / 18.2x
- Revenue (TTM)
- $49.73B (+14.7% YoY)
- EPS Growth
- Q3 EPS $0.87 (TTM +44.4%)
- Beta
- 1.61 (more volatile than the market)
- Latest Earnings
- Reported Oct 20, 2026 (after the close)
Volatility snapshot (Options Swing Helper)
- Expected Move (30d)
- ±$7.04 (±10.78%)
- 1 SD Range
- $58.27 - $72.35
- HV Rank (Ann. HV)
- 37.21% (31.23%)
- Premium
- Fair
The expected move and 1 SD range come from the Options Swing Helper indicator on the chart; they describe how far the market is pricing the stock to move over 30 days, not where it will go.
Our read: Bearish (Near Oversold)
The reading leans negative: price is under all three EMAs, which are all pointing down, the stock just made a new 52-week low, and the chart's MACD is below its signal. Other signals are less one-sided: the quarter itself beat estimates, analyst consensus is Buy with an average target well above the price, RSI is near 30 rather than deep in oversold territory, and options premium is only mid-range. The guidance cut on advertising is the detail the market reacted to, and the next thing to watch is whether the stock can hold the $64 to $65 area.
Not investment advice, illustrative and educational only.
Learn how to read this
- Options Swing Helper : the free TradingView indicator behind the expected-move cone and HV Rank
- Free options lessons : contracts, the Greeks, income strategies and volatility
- Bullish, bearish and VIX : terms used in these reports
- Signal Desk : research any stock and practice with a paper-trading account