
Options Swing Helper: Free TradingView Indicator for Options Traders
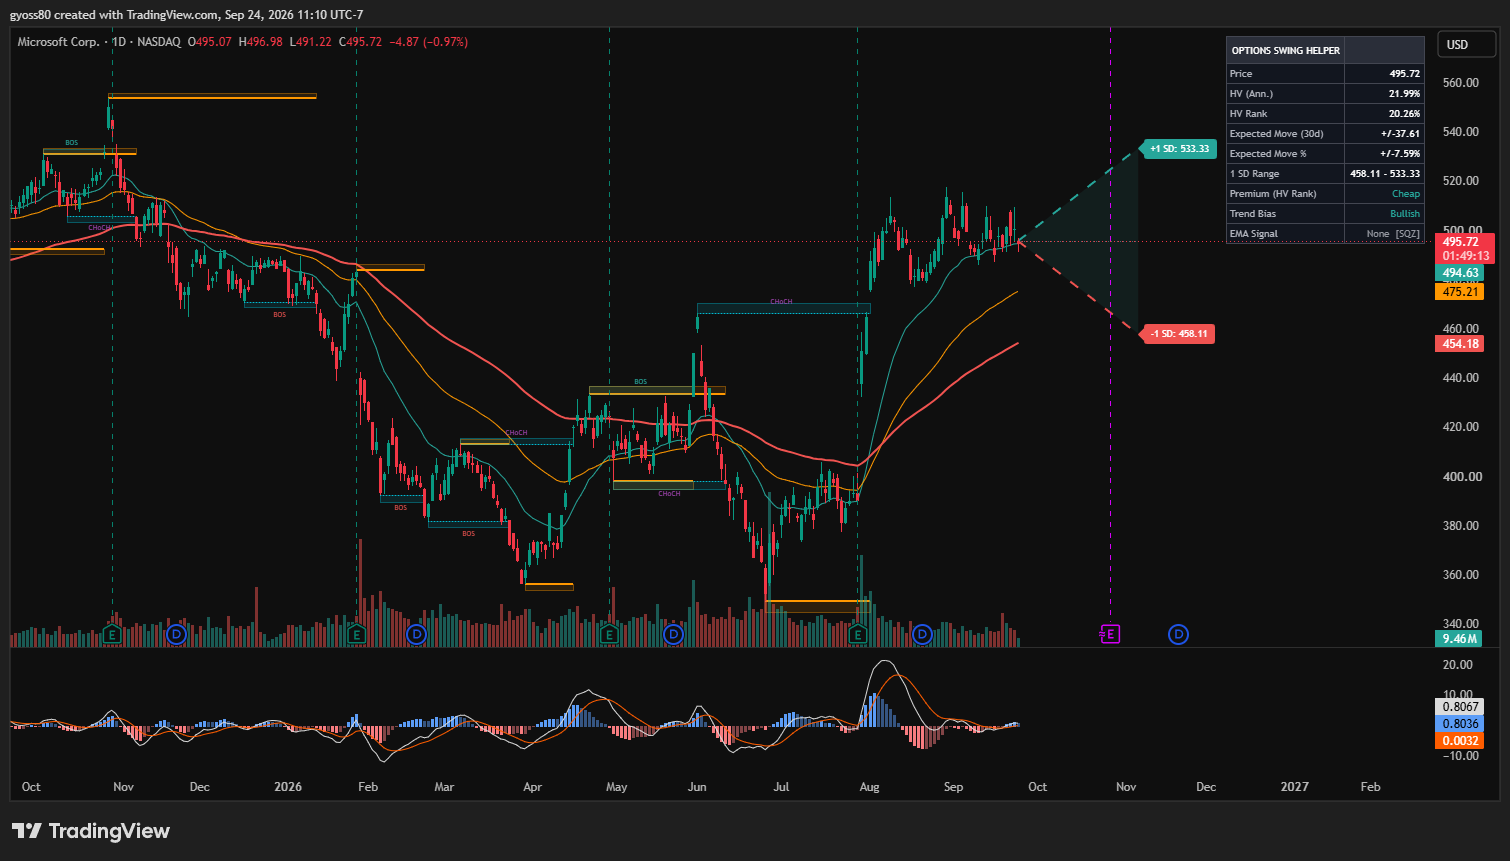
Options Swing Helper puts an expected-move cone, a volatility rank, trend tools and market structure into one dashboard on your TradingView chart, so you can judge a stock’s probable price range and momentum at a glance before you buy or sell option premium. It is open source, free to use, and built by Academia Trade.
Also known as Undertow.
Opens the script page on TradingView, where you can add it to any chart with “Use on chart”.
What it shows
Expected move cone
Projects a forward price range from annualized historical volatility, scaled by the square root of time for the number of days you choose. It draws the +1 and -1 standard deviation levels and a center line, so you can see where price could plausibly be by a given date.
HV Rank: cheap or rich volatility?
HV Rank is the percentile of current volatility against its own lookback history. The dashboard flags volatility as Cheap, Fair or Rich, which is useful context before buying or selling premium.
Moving averages and signals
Three configurable EMAs, with optional buy and sell triggers from EMA crossovers or price crossing an EMA. An optional filter can require the long-term EMA’s direction and slope to agree before a signal appears.
Market structure
Automatic swing high and swing low detection, classified as strong or weak, with zone boxes and BOS and CHoCH break labels to show trend structure and possible reversals.
The dashboard
A live table with price, historical volatility, HV Rank, expected move in points and percent, the 1 SD range, a volatility premium read, trend bias and the current EMA signal. Every group of settings is customizable.
How to add it to your chart
- Open the script page on TradingView with the button above.
- Click “Use on chart”, or open any chart, choose Indicators and search for “Options Swing Helper” by gyoss80.
- Open the indicator settings to change the cone length in days, the moving averages and what the dashboard shows.
What to keep in mind
The cone uses historical volatility as a stand-in for implied volatility, so it will not match the implied move in an option chain exactly. It is a visual aid for learning, not a prediction.
Frequently asked questions
Is Options Swing Helper free?
Yes. It is an open-source indicator published on TradingView and free to use.
Does it use implied volatility?
No. It uses annualized historical volatility as a stand-in for implied volatility, and shows an HV Rank so you can tell whether volatility is cheap, fair or rich compared with its own history.
Where can I learn to use it?
Our free options lessons explain contracts, the Greeks and income strategies. Start with the first lesson on the course page.
Keep learning
- Options trading course in English and Spanish
- Free trade simulator: practice reading EMA, RSI and MACD
For informational and educational purposes only. Not financial advice.