
Daily chart analysis · October 16, 2026
Palantir Technologies Inc. (PLTR) stock analysis: October 16, 2026
Intraday snapshot, Fri Oct 16, 2026 at 11:22 AM (UTC-7). Not a closing price.
Educational content only, not investment advice. Chart readings are snapshots taken at the time shown, not closing prices, and nothing here predicts where a stock will go.
Why PLTR today
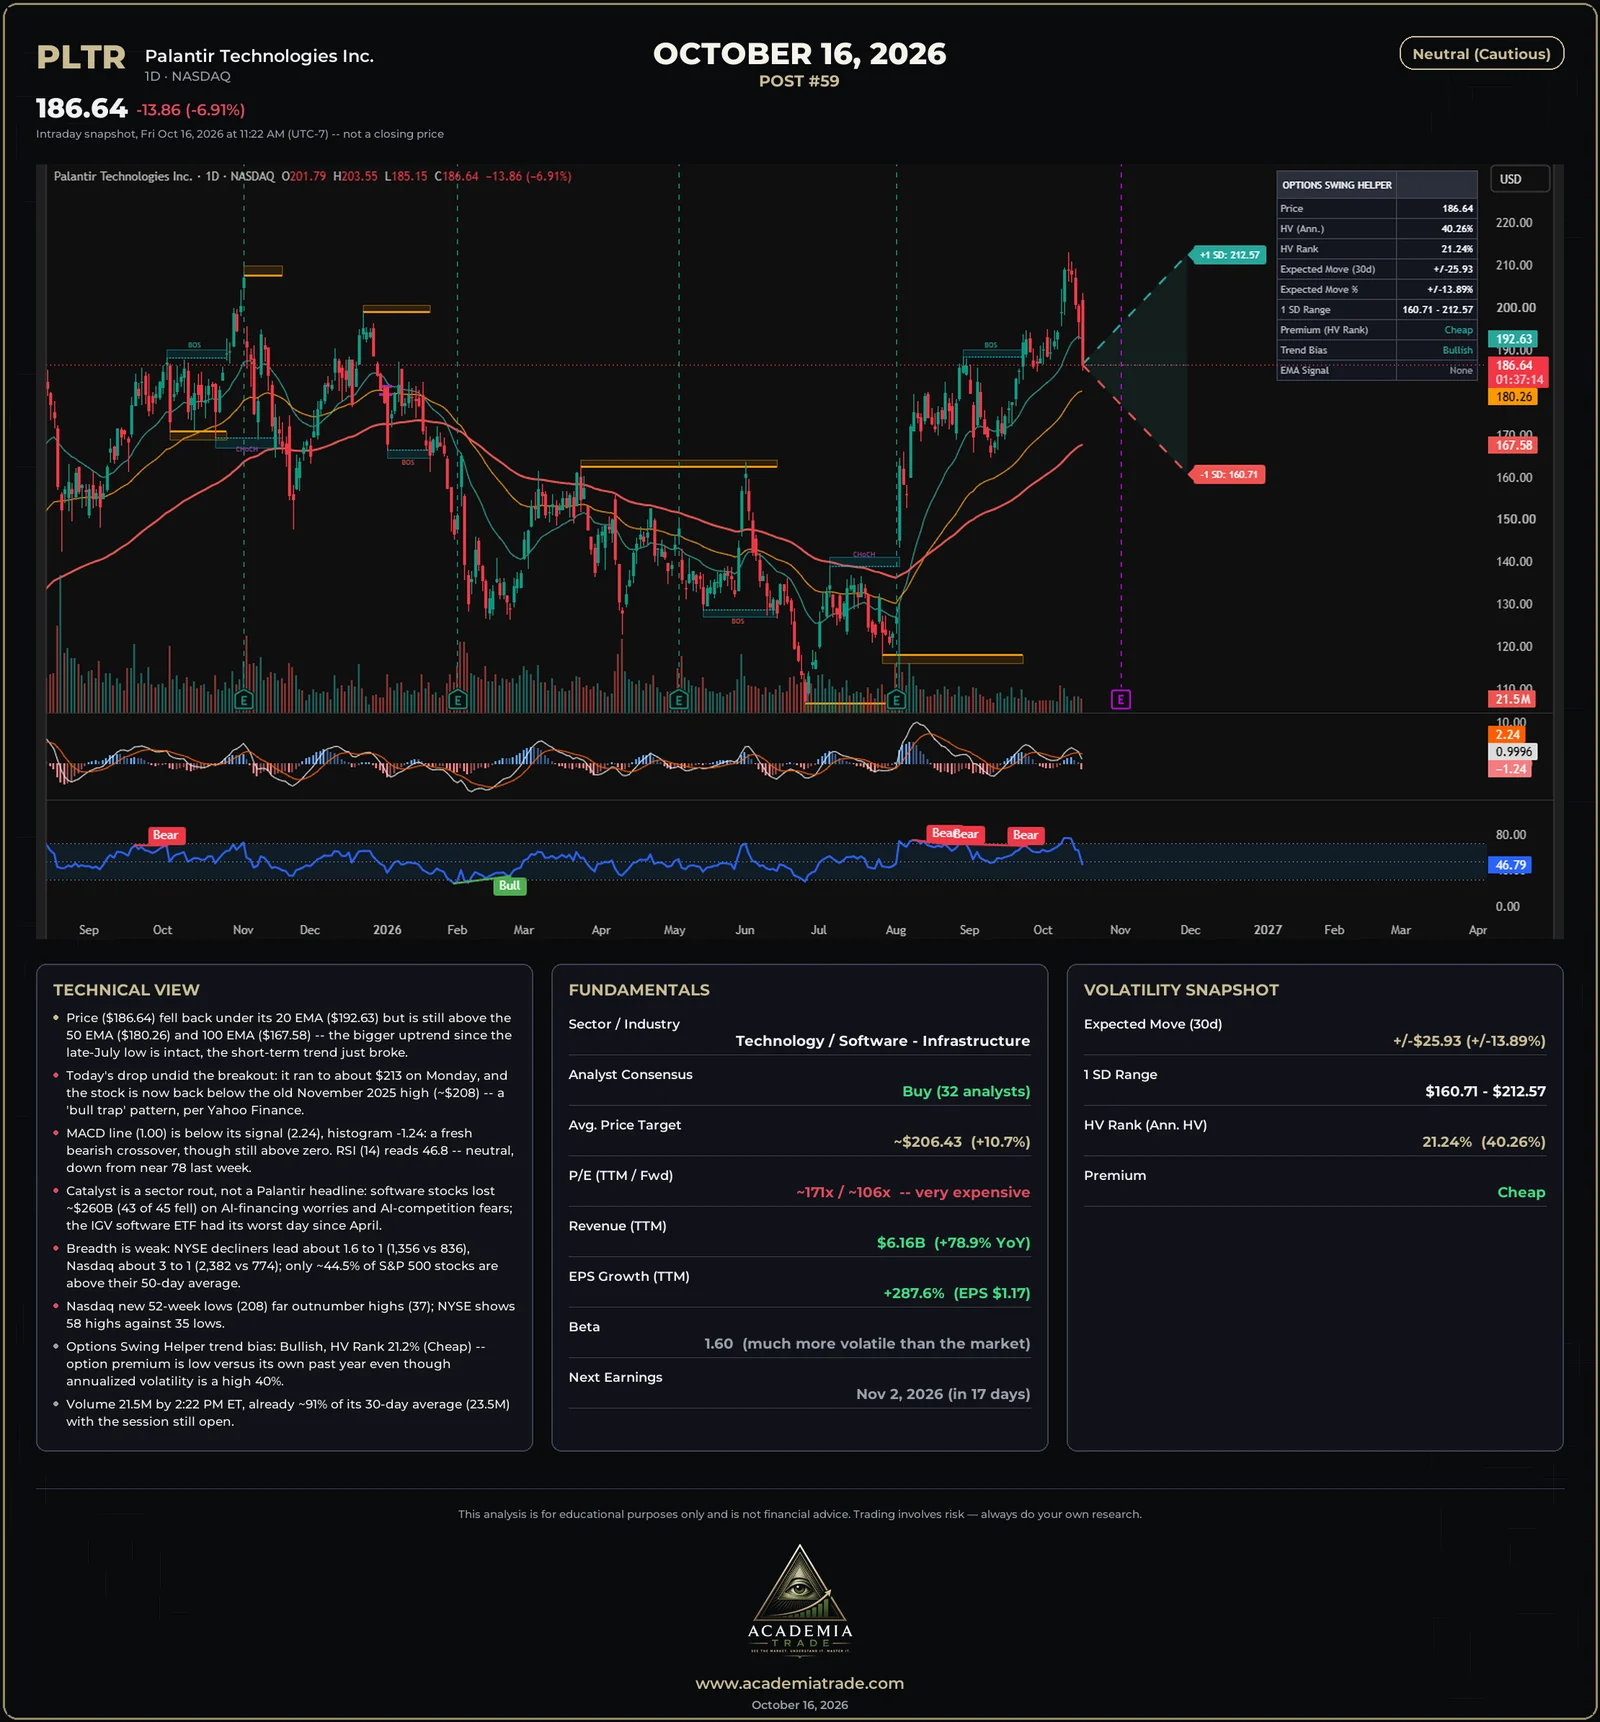
Palantir fell hard in a sector rout, not on a company headline: software stocks lost about $260B (43 of 45 fell) on AI-financing worries and AI-competition fears, and the IGV software ETF had its worst day since April.
Technical view
- Price ($186.64) fell back under its 21 EMA ($192.63) but is still above the 50 EMA ($180.26) and 100 EMA ($167.58): the bigger uptrend since the late-July low is intact, while the short-term trend broke.
- Today’s drop undid the breakout: the stock ran to about $213 on Monday and is now back below the old November 2025 high (~$208), a “bull trap” pattern.
- MACD line (1.00) is below its signal (2.24), histogram -1.24: a fresh bearish crossover, though still above zero. RSI (14) reads 46.8, neutral, down from near 78 last week.
- Volume was 21.5M by 2:22 PM ET, already about 91% of its 30-day average (23.5M) with the session still open.
Market breadth and new highs / lows
- NYSE decliners lead about 1.6 to 1 (1,356 vs 836), Nasdaq about 3 to 1 (2,382 vs 774). Only about 44.5% of S&P 500 stocks are above their 50-day average.
- Nasdaq new 52-week lows (208) far outnumber highs (37); the NYSE shows 58 highs against 35 lows.
Fundamentals
- Sector / industry
- Technology / Software - Infrastructure
- Analyst consensus
- Buy (32 analysts)
- Average price target
- ~$206.43 (+10.7%)
- P/E (TTM / forward)
- ~171x / ~106x (very expensive)
- Revenue (TTM)
- $6.16B (+78.9% YoY)
- EPS growth (TTM)
- +287.6% (EPS $1.17)
- Beta
- 1.60 (much more volatile than the market)
- Next earnings
- Nov 2, 2026 (in 17 days)
Volatility snapshot (Options Swing Helper)
- Expected move (30 days)
- ±$25.93 (±13.89%)
- 1 SD range
- $160.71 – $212.57
- HV Rank (annualized HV)
- 21.24% (40.26%)
- Option premium vs. its own past year
- Cheap
- Trend bias
- Bullish
Option premium is low versus its own past year even though annualized volatility is a high 40%. The expected move comes from the Options Swing Helper indicator and is not a forecast.
Our read: Neutral (Cautious)
The picture is mixed. The longer uptrend is intact and the fundamentals are growing fast, but the stock is very expensive on earnings, the short-term trend just broke, MACD turned down, and the sell-off was driven by the whole software sector. The reading is neutral and cautious: wait for the sector to settle before drawing conclusions.
Not investment advice, illustrative and educational only.
Learn how to read this
- Options Swing Helper : the free TradingView indicator behind the expected-move cone and HV Rank
- Free options lessons : contracts, the Greeks, income strategies and volatility
- Bullish, bearish and VIX : terms used in these reports
- Signal Desk : research any stock and practice with a paper-trading account