
Daily chart analysis · October 19, 2026
Amazon.com, Inc. (AMZN) stock analysis: October 19, 2026
Intraday snapshot, Mon Oct 19, 2026 at 11:19 AM (UTC-7). Not a closing price.
Educational content only, not investment advice. Chart readings are snapshots taken at the time shown, not closing prices, and nothing here predicts where a stock will go.
Why AMZN today
Morgan Stanley named Amazon a Top Pick and raised its price target to $350 from $335 on stronger AWS growth forecasts. Shares jumped about 5% in a tech rebound after the Nasdaq's worst week since June.
Technical view
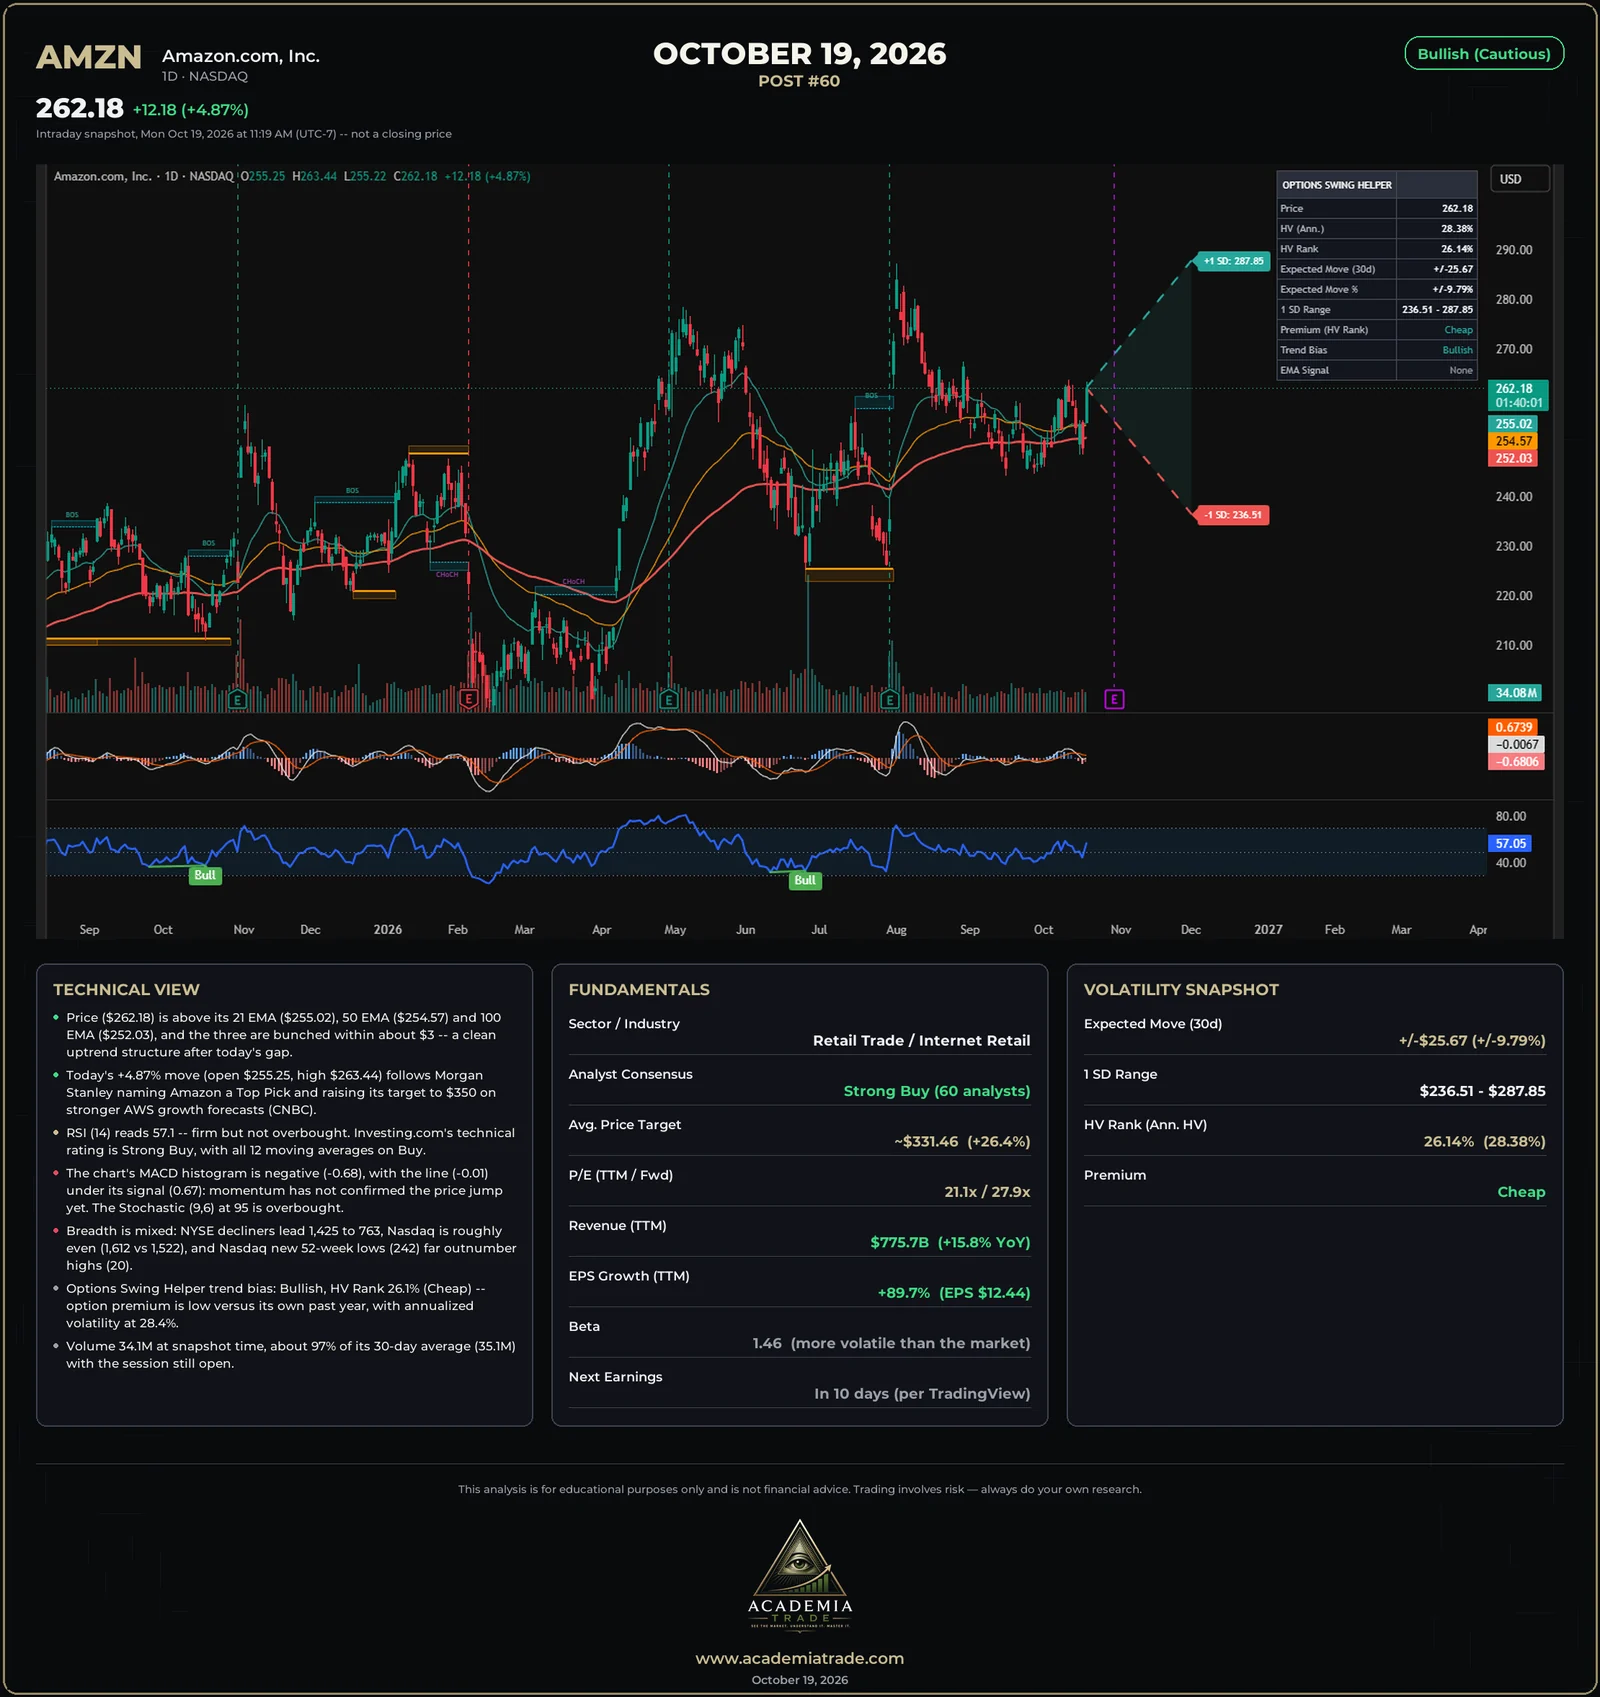
- Price ($262.18) is above its 21 EMA ($255.02), 50 EMA ($254.57) and 100 EMA ($252.03), and the three are bunched within about $3: a clean uptrend structure after today's gap.
- Today's +4.87% move (open $255.25, high $263.44) follows Morgan Stanley naming Amazon a Top Pick and raising its target to $350 on stronger AWS growth forecasts (CNBC).
- RSI (14) reads 57.1: firm but not overbought. Investing.com's technical rating is Strong Buy, with all 12 moving averages on Buy.
- The chart's MACD histogram is negative (-0.68), with the line (-0.01) under its signal (0.67): momentum has not confirmed the price jump yet. The Stochastic (9,6) at 95 is overbought.
- Breadth is mixed: NYSE decliners lead 1,425 to 763, Nasdaq is roughly even (1,612 vs 1,522), and Nasdaq new 52-week lows (242) far outnumber highs (20).
- Options Swing Helper trend bias: Bullish, HV Rank 26.1% (Cheap): option premium is low versus its own past year, with annualized volatility at 28.4%.
- Volume 34.1M at snapshot time, about 97% of its 30-day average (35.1M) with the session still open.
Market breadth and new highs / lows
- NYSE: 763 advancers vs 1,425 decliners, negative breadth. Nasdaq: 1,612 vs 1,522, roughly even.
- About 45.1% of S&P 500 stocks were above their 50-day average at Friday's close, up from 35.0% on Oct 14.
- Nasdaq new 52-week lows (242) far outnumber highs (20); the S&P 500 shows 10 highs against 2 lows (Reuters, 11:42 AM ET).
Fundamentals
- Sector / Industry
- Retail Trade / Internet Retail
- Analyst Consensus
- Strong Buy (60 analysts)
- Avg. Price Target
- ~$331.46 (+26.4%)
- P/E (TTM / Fwd)
- 21.1x / 27.9x
- Revenue (TTM)
- $775.7B (+15.8% YoY)
- EPS Growth (TTM)
- +89.7% (EPS $12.44)
- Beta
- 1.46 (more volatile than the market)
- Next Earnings
- In 10 days (per TradingView)
Volatility snapshot (Options Swing Helper)
- Expected Move (30d)
- ±$25.67 (±9.79%)
- 1 SD Range
- $236.51 - $287.85
- HV Rank (Ann. HV)
- 26.14% (28.38%)
- Premium
- Cheap
The expected move and 1 SD range come from the Options Swing Helper indicator on the chart; they describe how far the market is pricing the stock to move over 30 days, not where it will go.
Our read: Bullish (Cautious)
The trend structure and analyst support are strong: price is above all three EMAs, the technical rating is Strong Buy, and revenue and earnings are growing. The cautions are real too: the chart's MACD has not confirmed the jump, the Stochastic is overbought after a one-day gap, and market breadth is still shaky. The reading leans positive, with the gap as the main thing to watch.
Not investment advice, illustrative and educational only.
Learn how to read this
- Options Swing Helper : the free TradingView indicator behind the expected-move cone and HV Rank
- Free options lessons : contracts, the Greeks, income strategies and volatility
- Bullish, bearish and VIX : terms used in these reports
- Signal Desk : research any stock and practice with a paper-trading account