
Daily chart analysis · October 15, 2026
Chevron Corporation (CVX) stock analysis: October 15, 2026
Intraday snapshot, Thu Oct 15, 2026 at 11:07 AM (UTC-7). Not a closing price.
Educational content only, not investment advice. Chart readings are snapshots taken at the time shown, not closing prices, and nothing here predicts where a stock will go.
Why CVX today
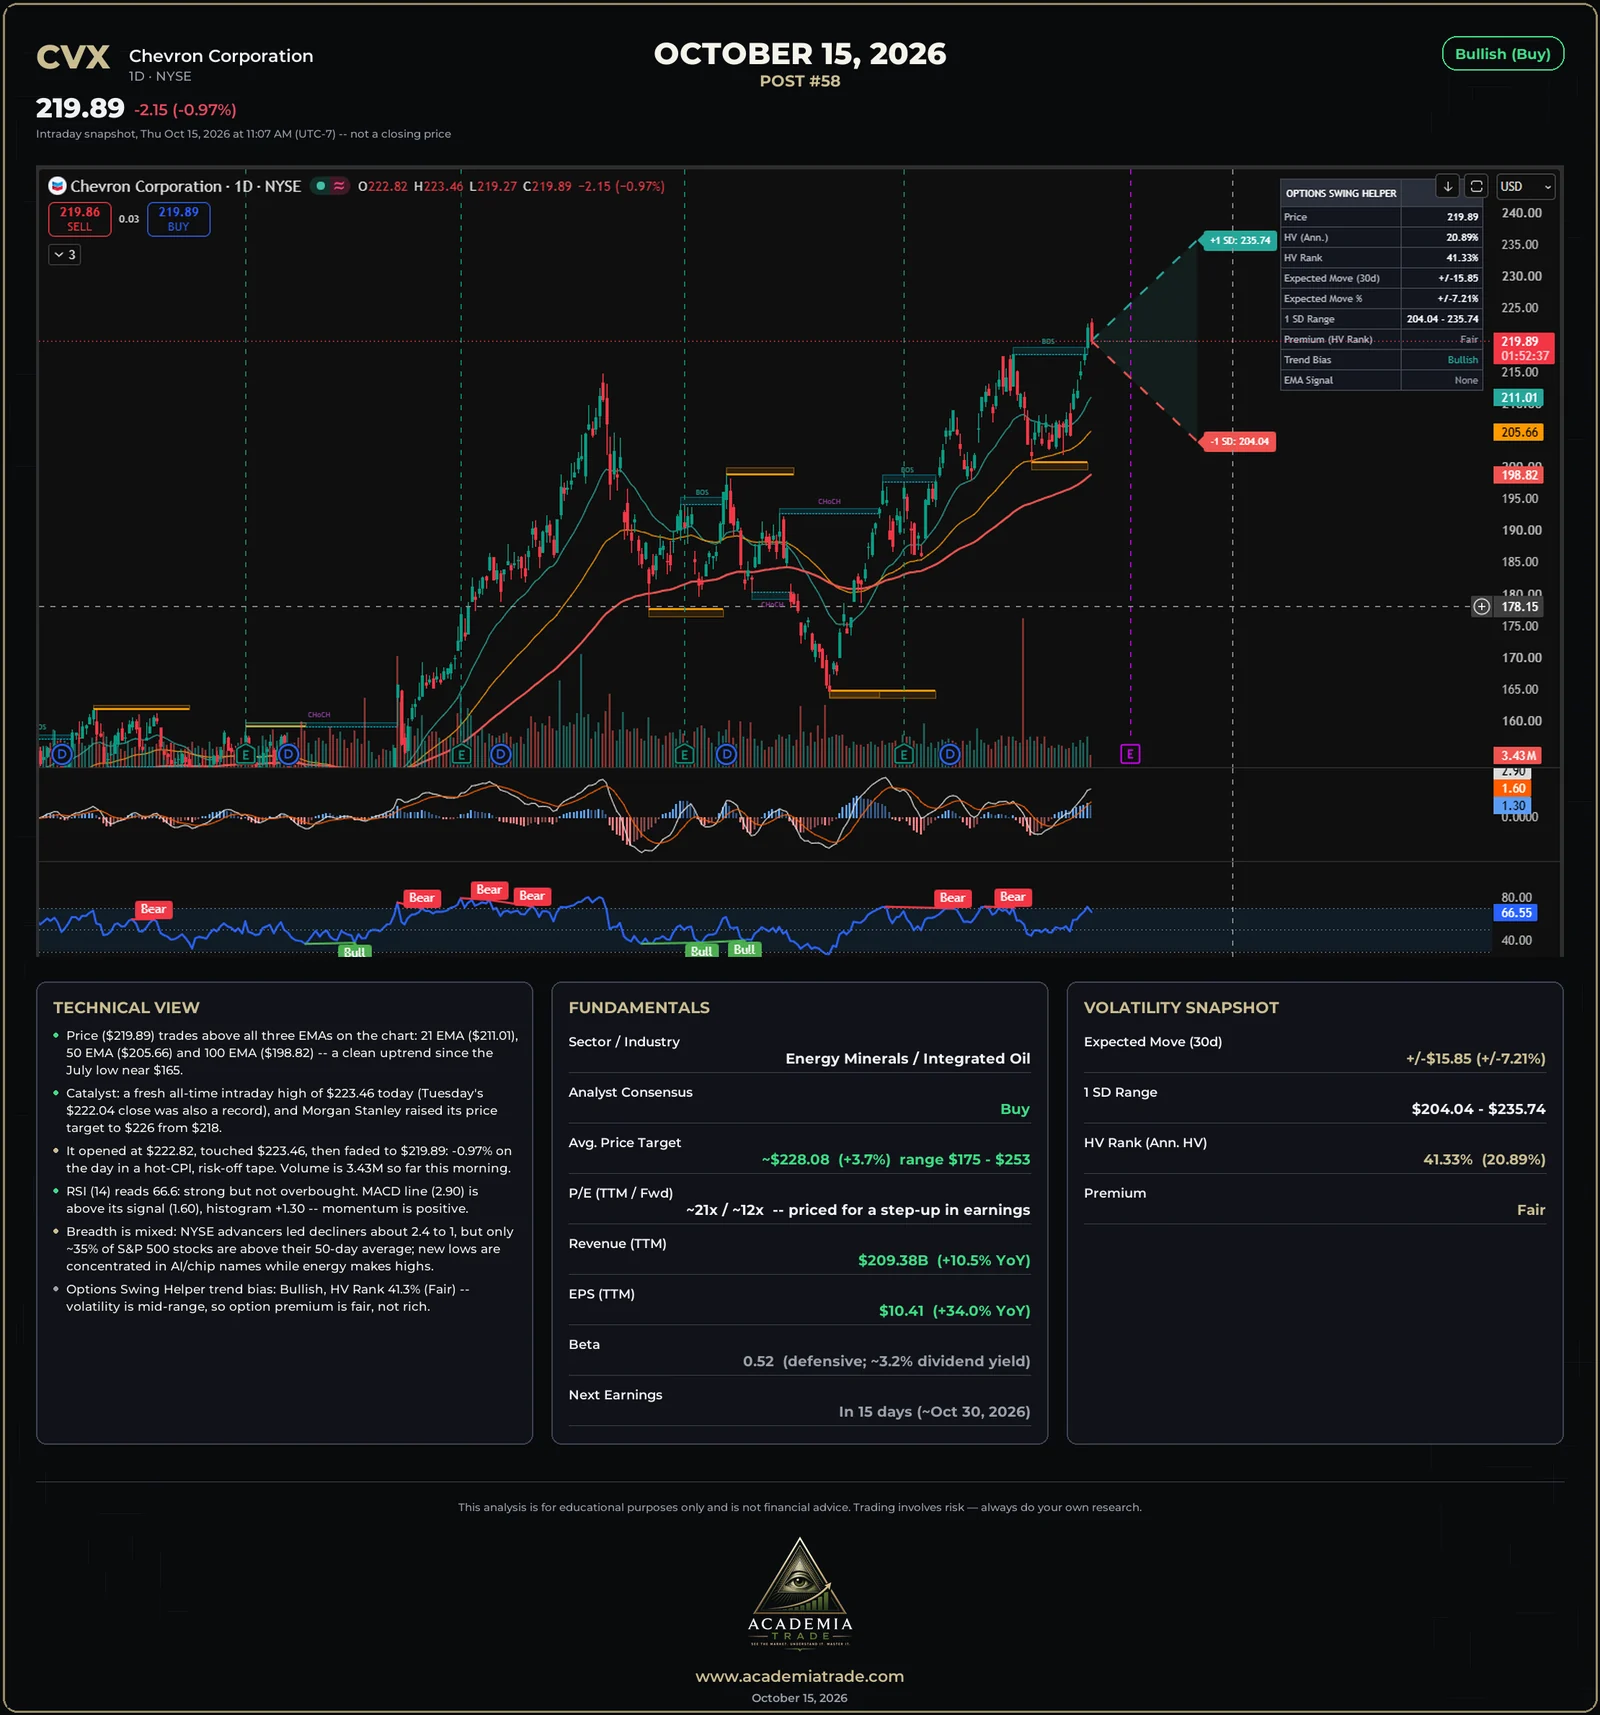
Chevron printed a fresh all-time intraday high of $223.46 on the heels of Tuesday’s record close of $222.04, then cooled as the market digested a hotter-than-expected inflation print. Morgan Stanley raised its price target to $226 from $218.
Technical view
- Price ($219.89) trades above all three EMAs on the chart: 21 EMA ($211.01), 50 EMA ($205.66) and 100 EMA ($198.82), a clean uptrend since the July low near $165.
- It opened at $222.82, touched $223.46, then faded to $219.89, down 0.97% in a hot-CPI, risk-off tape. Volume was 3.43M so far that morning.
- RSI (14) reads 66.6: strong but not overbought. The MACD line (2.90) is above its signal (1.60), histogram +1.30, so momentum is positive.
- Investing.com rates the technicals Strong Buy. The Stochastic (9,6) near 16 reads oversold after the pullback from the high: more a mean-reversion blip than a trend change.
Market breadth and new highs / lows
- NYSE advancers led decliners roughly 1,568 to 645 (about 2.4 to 1); Nasdaq advancers led about 2,117 to 1,128 (1.9 to 1).
- Only about 35% of S&P 500 stocks were above their 50-day average, down sharply from about 55% the prior session; about 49% were above their 200-day.
- S&P 500: 23 new highs, 0 new lows. Nasdaq: 51 highs against 351 lows. New highs are concentrated in defensive and energy names while new lows skew to AI and chip stocks.
Fundamentals
- Sector / industry
- Energy Minerals / Integrated Oil
- Analyst consensus
- Buy
- Average price target
- ~$228.08 (+3.7%), range $175 – $253
- P/E (TTM / forward)
- ~21x / ~12x (priced for a step-up in earnings)
- Revenue (TTM)
- $209.38B (+10.5% YoY)
- EPS (TTM)
- $10.41 (+34.0% YoY)
- Beta
- 0.52 (defensive; ~3.2% dividend yield)
- Next earnings
- In 15 days (~Oct 30, 2026)
Volatility snapshot (Options Swing Helper)
- Expected move (30 days)
- ±$15.85 (±7.21%)
- 1 SD range
- $204.04 – $235.74
- HV Rank (annualized HV)
- 41.33% (20.89%)
- Option premium vs. its own past year
- Fair
- Trend bias
- Bullish
Volatility is mid-range, so option premium is fair, not rich. The expected move comes from the Options Swing Helper indicator and is not a forecast.
Our read: Bullish (Buy)
The trend is clearly up with a record high, momentum is positive, and the fundamentals are improving: revenue up 10.5%, EPS up 34%, and a fresh analyst target raise. The market backdrop is mixed, with a hot inflation print and a split, rotation-driven tape, so today’s small pullback from an all-time high reads as a pause, not a reversal.
Not investment advice, illustrative and educational only.
Learn how to read this
- Options Swing Helper : the free TradingView indicator behind the expected-move cone and HV Rank
- Free options lessons : contracts, the Greeks, income strategies and volatility
- Bullish, bearish and VIX : terms used in these reports
- Signal Desk : research any stock and practice with a paper-trading account