
Daily chart analysis · October 27, 2026
The Boeing Company (BA) stock analysis: October 27, 2026
Intraday snapshot, Tue Oct 27, 2026 at 11:08 AM (UTC-7). Not a closing price.
Educational content only, not investment advice. Chart readings are snapshots taken at the time shown, not closing prices, and nothing here predicts where a stock will go.
Why BA today
Boeing fell about 9.7% on Tuesday after its Q3 report. It posted an adjusted loss of $0.34 a share, said it will not raise 737 MAX output to 52 a month until the second half of 2027 because wing production is slower than planned, and said it will miss its 2026 737 MAX delivery target. Revenue rose 4% to $24.2 billion and the order backlog reached a record $745 billion, but the commercial airplane unit lost $697 million and analysts pointed to a later free-cash-flow recovery than they had expected.
Technical view
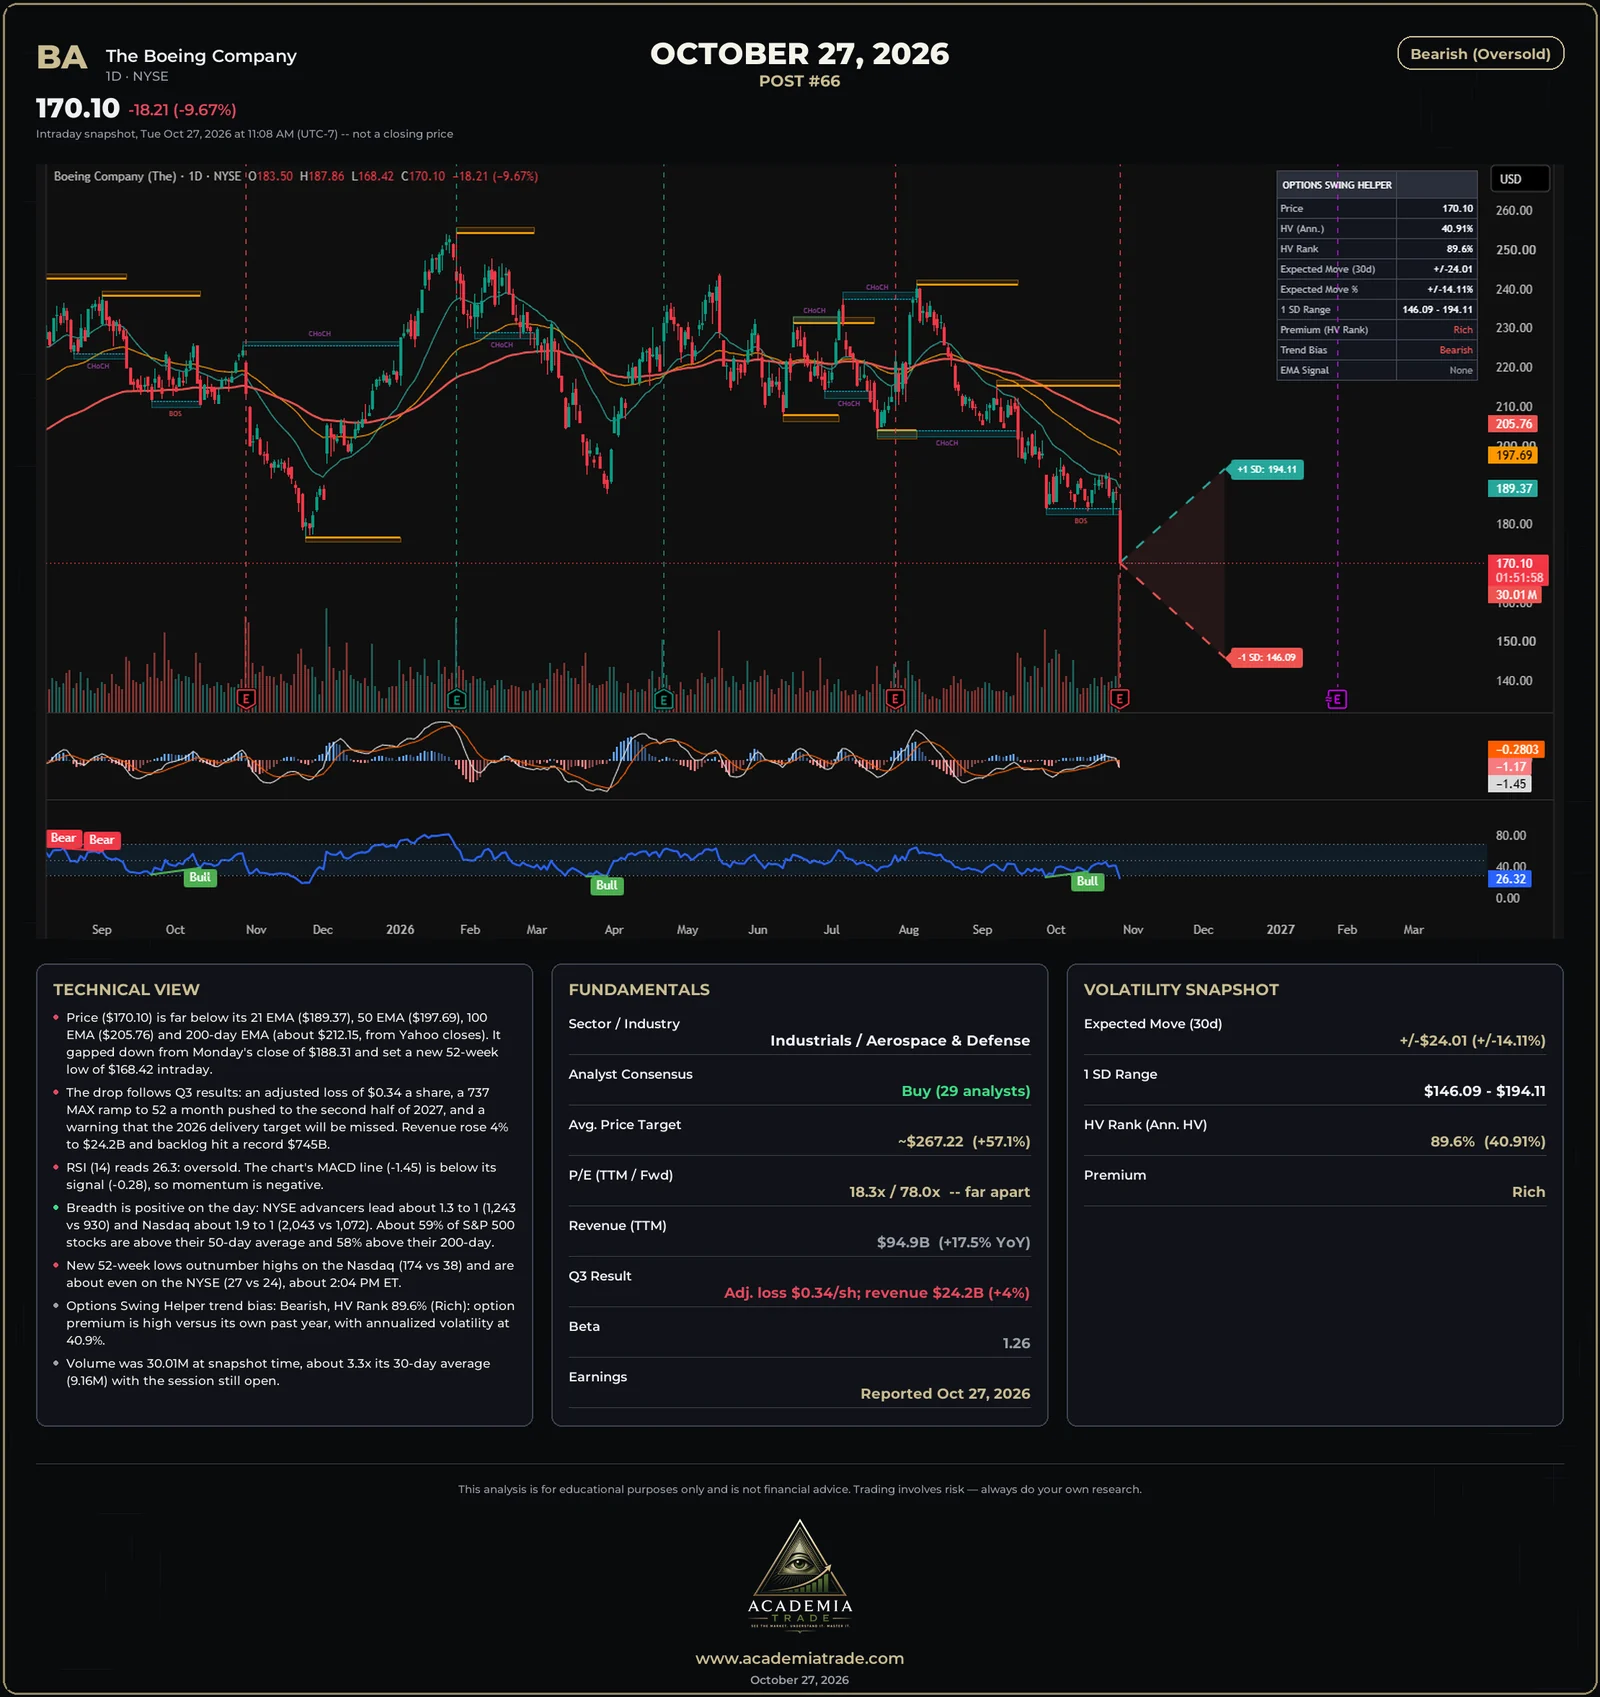
- Price ($170.10) is far below its 21 EMA ($189.37), 50 EMA ($197.69), 100 EMA ($205.76) and 200-day EMA (about $212.15, from daily closes). It gapped down from Monday's close of $188.31 and set a new 52-week low of $168.42 intraday.
- The drop follows Q3 results: an adjusted loss of $0.34 a share, a 737 MAX ramp to 52 a month pushed to the second half of 2027, and a warning that the 2026 delivery target will be missed. Revenue rose 4% to $24.2B and backlog hit a record $745B.
- RSI (14) reads 26.3: oversold. The chart's MACD line (-1.45) is below its signal (-0.28), so momentum is negative.
- Breadth is positive on the day: NYSE advancers lead about 1.3 to 1 (1,243 vs 930) and Nasdaq about 1.9 to 1 (2,043 vs 1,072). About 59% of S&P 500 stocks are above their 50-day average and 58% above their 200-day.
- New 52-week lows outnumber highs on the Nasdaq (174 vs 38) and are about even on the NYSE (27 vs 24), about 2:04 PM ET.
- Options Swing Helper trend bias: Bearish, HV Rank 89.6% (Rich): option premium is high versus its own past year, with annualized volatility at 40.9%.
- Volume was 30.01M at snapshot time, about 3.3x its 30-day average (9.16M) with the session still open.
Market breadth and new highs / lows
- NYSE: 1,243 advancers vs 930 decliners, about 1.3 to 1 positive. Nasdaq: 2,043 vs 1,072, about 1.9 to 1 positive (midday).
- About 59% of S&P 500 stocks were above their 50-day average and 58% above their 200-day (Barchart, about 1:38 PM ET): participation is a little better than half the index.
- New 52-week highs vs lows (Barchart, about 2:04 PM ET): NYSE 24 vs 27, Nasdaq 38 vs 174, so lows lead, mostly on the Nasdaq.
Fundamentals
- Sector / Industry
- Industrials / Aerospace & Defense
- Analyst Consensus
- Buy (29 analysts)
- Avg. Price Target
- ~$267.22 (+57.1%)
- P/E (TTM / Fwd)
- 18.3x / 78.0x : far apart
- Revenue (TTM)
- $94.9B (+17.5% YoY)
- Q3 Result
- Adj. loss $0.34/sh; revenue $24.2B (+4%)
- Beta
- 1.26
- Earnings
- Reported Oct 27, 2026
Volatility snapshot (Options Swing Helper)
- Expected Move (30d)
- ±$24.01 (±14.11%)
- 1 SD Range
- $146.09 - $194.11
- HV Rank (Ann. HV)
- 89.6% (40.91%)
- Premium
- Rich
The expected move and 1 SD range come from the Options Swing Helper indicator on the chart; they describe how far the market is pricing the stock to move over 30 days, not where it will go.
Our read: Bearish (Oversold)
The reading is bearish but stretched. Price is far below all four moving averages after a gap down to a new 52-week low, and the chart's MACD is below its signal, while RSI near 26 shows the selling is already deep. The broad market is firm today, so this is a stock-specific reaction to a later 737 MAX ramp and a weaker cash-flow outlook. Option premium is rich (HV Rank about 90%) with an expected move of about 14%. Fundamentals are mixed: a Buy consensus with a $267 average target, against a 78x forward P/E and a Q3 loss. The levels to watch are today's low near $168 on the downside and the 21 EMA near $189, where the gap began, on the upside.
Not investment advice, illustrative and educational only.
Learn how to read this
- Options Swing Helper : the free TradingView indicator behind the expected-move cone and HV Rank
- Free options lessons : contracts, the Greeks, income strategies and volatility
- Bullish, bearish and VIX : terms used in these reports
- Signal Desk : research any stock and practice with a paper-trading account