
Daily chart analysis · October 30, 2026
Exxon Mobil Corporation (XOM) stock analysis: October 30, 2026
Intraday snapshot, Fri Oct 30, 2026 at 11:12 AM (UTC-7). Not a closing price.
Educational content only, not investment advice. Chart readings are snapshots taken at the time shown, not closing prices, and nothing here predicts where a stock will go.
Why XOM today
Exxon Mobil rose about 1.7% on Friday after its Q3 report. Adjusted earnings were $4.23 a share (GAAP $3.72), above estimates of roughly $3.90 to $4.12, with Energy Products earnings up on higher refining margins and 100% crude unit utilization at its U.S. Gulf Coast refineries. Operating cash flow was $25.7 billion and free cash flow was $19.1 billion, and net debt fell to $22.1 billion, nearly $11 billion lower year to date. Exxon declared a $1.07 quarterly dividend and set 2027 share repurchases at $20 billion, assuming reasonable market conditions.
Technical view
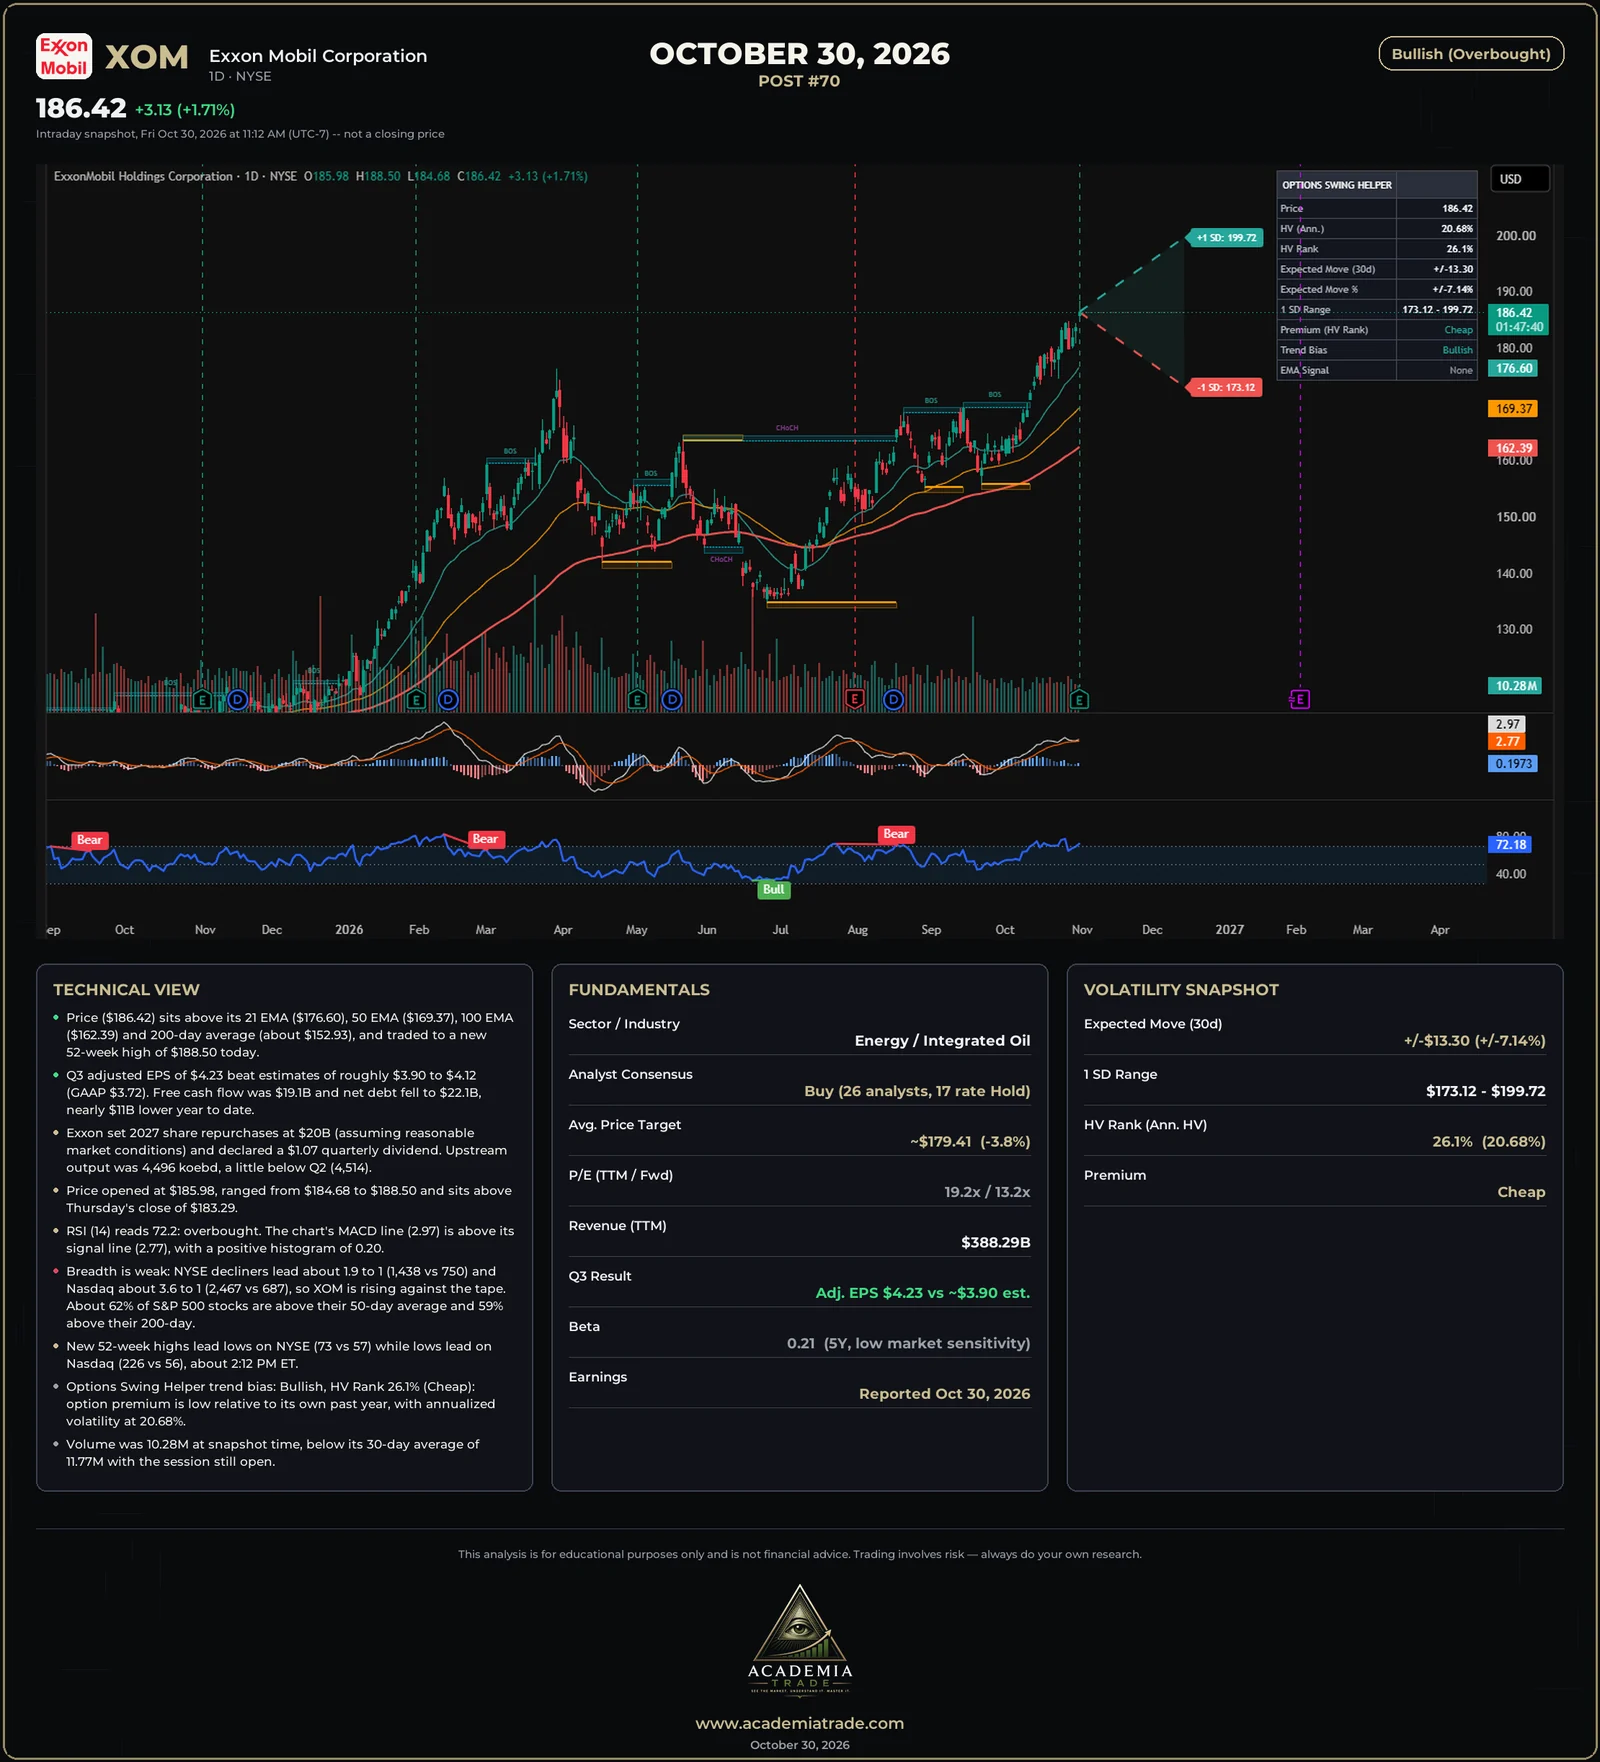
- Price ($186.42) sits above its 21 EMA ($176.60), 50 EMA ($169.37), 100 EMA ($162.39) and 200-day average (about $152.93), and traded to a new 52-week high of $188.50 today.
- Q3 adjusted EPS of $4.23 beat estimates of roughly $3.90 to $4.12 (GAAP $3.72). Free cash flow was $19.1B and net debt fell to $22.1B, nearly $11B lower year to date.
- Exxon set 2027 share repurchases at $20B (assuming reasonable market conditions) and declared a $1.07 quarterly dividend. Upstream output was 4,496 koebd, a little below Q2 (4,514).
- Price opened at $185.98, ranged from $184.68 to $188.50 and sits above Thursday's close of $183.29.
- RSI (14) reads 72.2: overbought. The chart's MACD line (2.97) is above its signal line (2.77), with a positive histogram of 0.20.
- Breadth is weak: NYSE decliners lead about 1.9 to 1 (1,438 vs 750) and Nasdaq about 3.6 to 1 (2,467 vs 687), so XOM is rising against the tape. About 62% of S&P 500 stocks are above their 50-day average and 59% above their 200-day.
- New 52-week highs lead lows on NYSE (73 vs 57) while lows lead on Nasdaq (226 vs 56), about 2:12 PM ET.
- Options Swing Helper trend bias: Bullish, HV Rank 26.1% (Cheap): option premium is low relative to its own past year, with annualized volatility at 20.68%.
- Volume was 10.28M at snapshot time, below its 30-day average of 11.77M with the session still open.
Market breadth and new highs / lows
- NYSE: 750 advancers vs 1,438 decliners, about 1.9 to 1 negative. Nasdaq: 687 vs 2,467, about 3.6 to 1 negative (afternoon).
- About 62% of S&P 500 stocks were above their 50-day average and 59% above their 200-day (Barchart, about 2:12 PM ET).
- New 52-week highs vs lows (Barchart, about 2:12 PM ET): NYSE 73 vs 57, Nasdaq 56 vs 226, so highs lead on NYSE and lows lead on Nasdaq.
Fundamentals
- Sector / Industry
- Energy / Integrated Oil
- Analyst Consensus
- Buy (26 analysts, 17 rate Hold)
- Avg. Price Target
- ~$179.41 (-3.8%)
- P/E (TTM / Fwd)
- 19.2x / 13.2x
- Revenue (TTM)
- $388.29B
- Q3 Result
- Adj. EPS $4.23 vs ~$3.90 est.
- Beta
- 0.21 (5Y, low market sensitivity)
- Earnings
- Reported Oct 30, 2026
Volatility snapshot (Options Swing Helper)
- Expected Move (30d)
- ±$13.30 (±7.14%)
- 1 SD Range
- $173.12 - $199.72
- HV Rank (Ann. HV)
- 26.1% (20.68%)
- Premium
- Cheap
The expected move and 1 SD range come from the Options Swing Helper indicator on the chart; they describe how far the market is pricing the stock to move over 30 days, not where it will go.
Our read: Bullish (Overbought)
The reading is bullish but stretched. Price is above its 21, 50 and 100 EMAs and its 200-day average (near $153) and set a new 52-week high of $188.50 today, with the chart's MACD above its signal. RSI is 72.2, which is overbought, price sits about 4% above the $179.41 average analyst target (17 of 26 analysts rate it Hold), and the broad market is weak, with decliners leading on both exchanges, so XOM is rising against the tape. Against that, the Q3 report beat estimates, free cash flow was $19.1 billion, net debt fell and Exxon set a $20 billion buyback for 2027. The forward P/E is about 13 and option premium is cheap (HV Rank 26.1%). The levels to watch are today's low near $184.68 and the 21 EMA near $176.60 on the downside, and today's high near $188.50 on the upside.
Not investment advice, illustrative and educational only.
Learn how to read this
- Options Swing Helper : the free TradingView indicator behind the expected-move cone and HV Rank
- Free options lessons : contracts, the Greeks, income strategies and volatility
- Bullish, bearish and VIX : terms used in these reports
- Signal Desk : research any stock and practice with a paper-trading account