
Daily chart analysis · November 2, 2026
Oracle Corporation (ORCL) stock analysis: November 2, 2026
Intraday snapshot, Mon Nov 2, 2026 at 11:06 AM (UTC-7). Not a closing price.
Educational content only, not investment advice. Chart readings are snapshots taken at the time shown, not closing prices, and nothing here predicts where a stock will go.
Why ORCL today
Oracle fell about 6% on Monday after saying it plans to raise up to $20 billion through bond and share sales. Filings cite general corporate purposes, including capital expenditure and debt repayment, and the company had flagged the funding target at last week's investor day. The news renewed worries about dilution and debt around its AI and cloud buildout. Stephens upgraded the stock to Overweight with a $213 target, while Wells Fargo cut its target to $250 from $280 and kept its Overweight rating.
Technical view
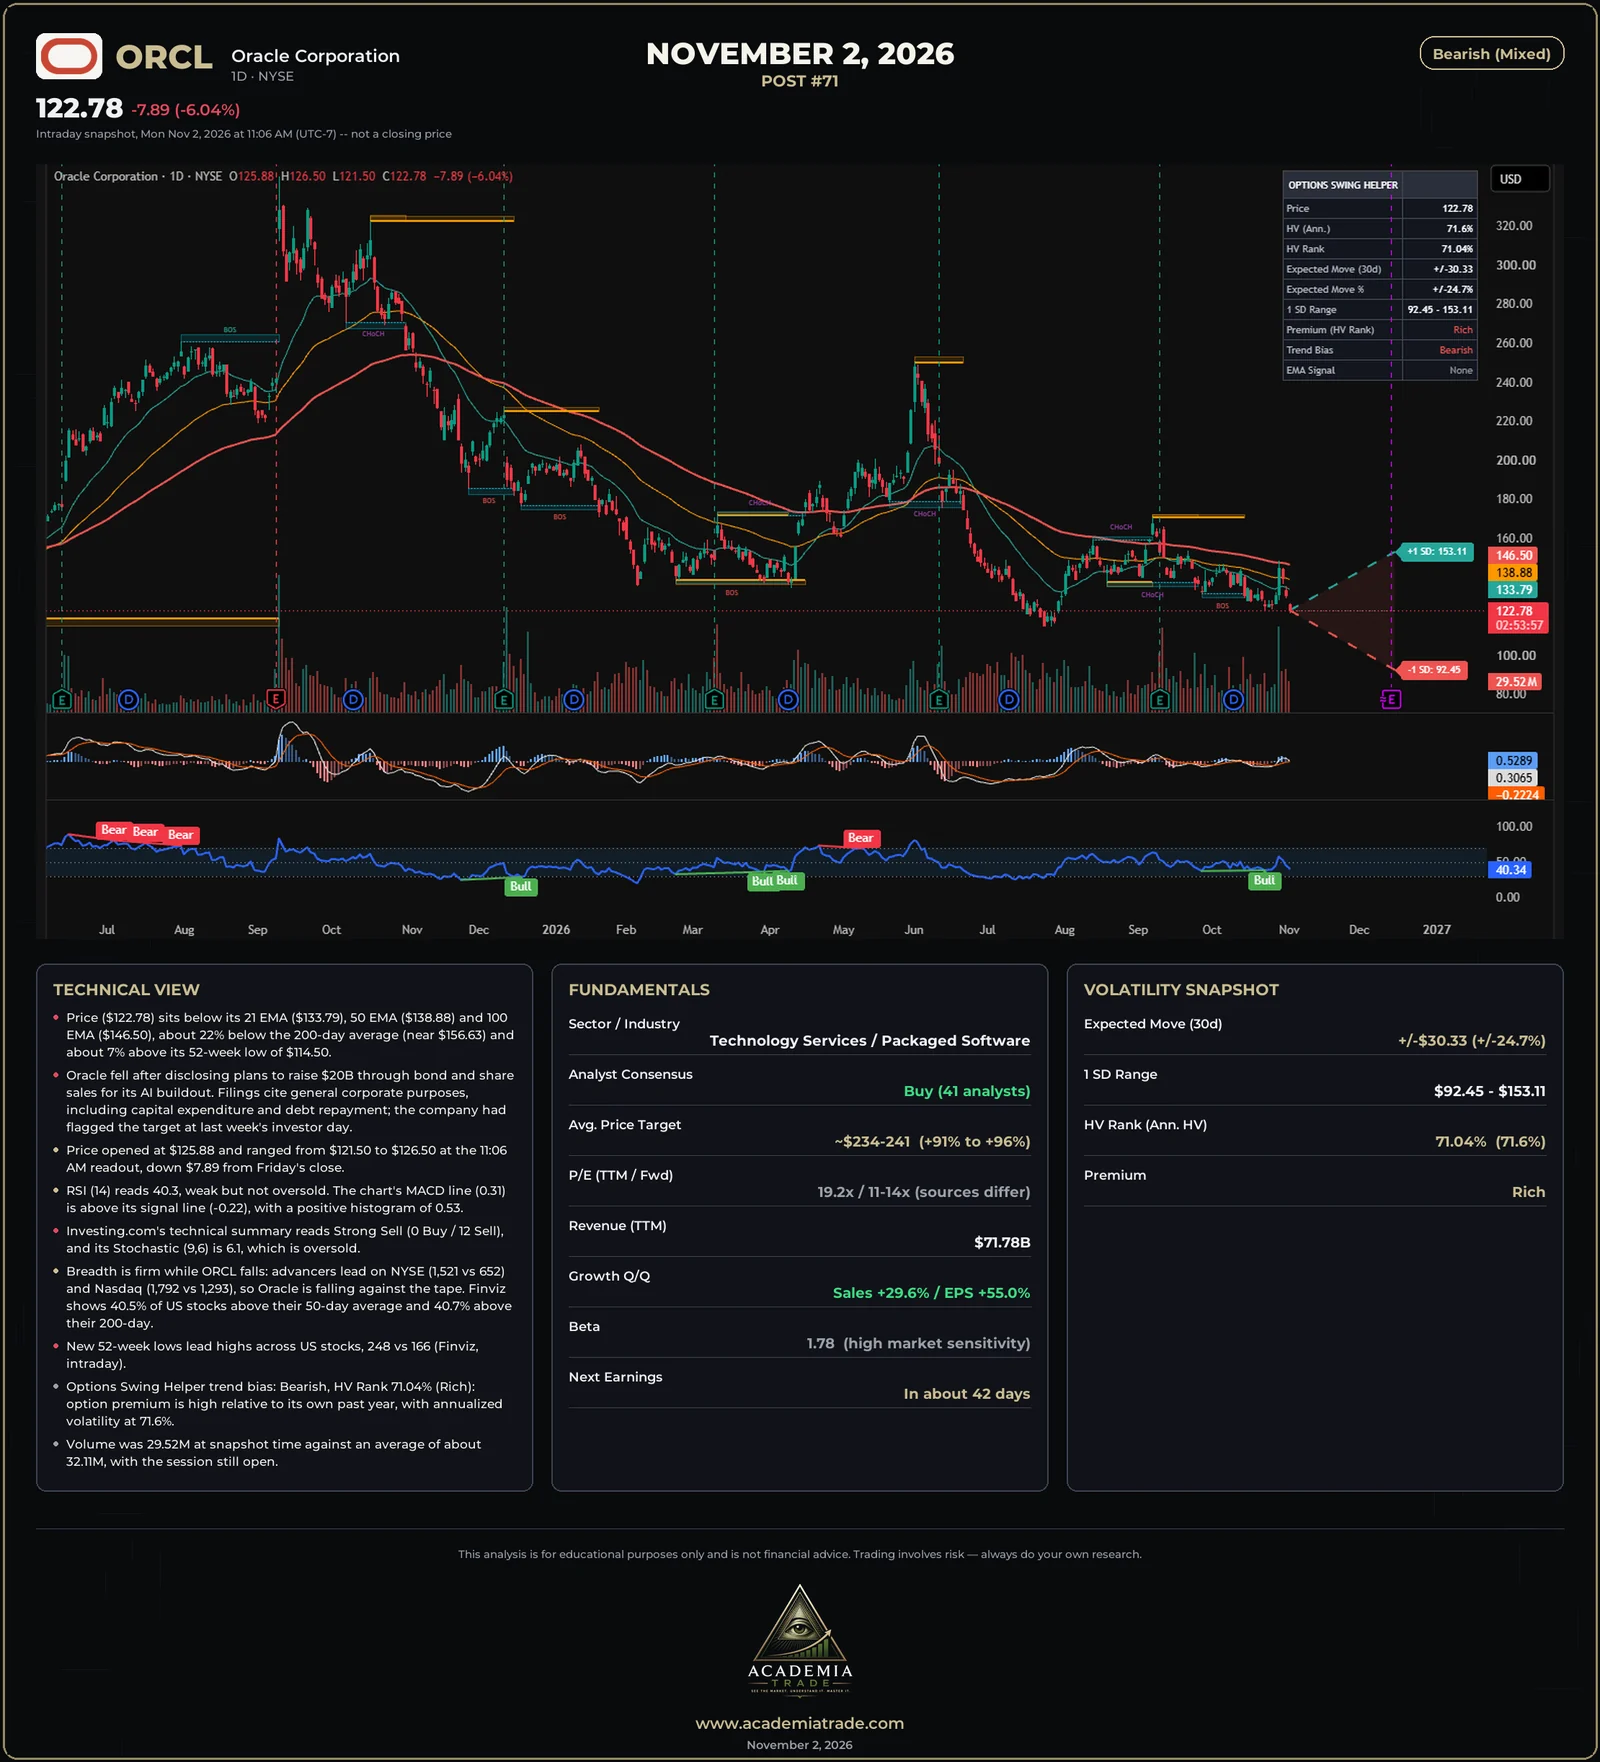
- Price ($122.78) sits below its 21 EMA ($133.79), 50 EMA ($138.88) and 100 EMA ($146.50), about 22% below the 200-day average (near $156.63) and about 7% above its 52-week low of $114.50.
- Oracle fell after disclosing plans to raise $20B through bond and share sales for its AI buildout. Filings cite general corporate purposes, including capital expenditure and debt repayment; the company had flagged the target at last week's investor day.
- Price opened at $125.88 and ranged from $121.50 to $126.50 at the 11:06 AM readout, down $7.89 from Friday's close.
- RSI (14) reads 40.3, weak but not oversold. The chart's MACD line (0.31) is above its signal line (-0.22), with a positive histogram of 0.53.
- Investing.com's technical summary reads Strong Sell (0 Buy / 12 Sell), and its Stochastic (9,6) is 6.1, which is oversold.
- Breadth is firm while ORCL falls: advancers lead on NYSE (1,521 vs 652) and Nasdaq (1,792 vs 1,293), so Oracle is falling against the tape. Finviz shows 40.5% of US stocks above their 50-day average and 40.7% above their 200-day.
- New 52-week lows lead highs across US stocks, 248 vs 166 (Finviz, intraday).
- Options Swing Helper trend bias: Bearish, HV Rank 71.04% (Rich): option premium is high relative to its own past year, with annualized volatility at 71.6%.
- Volume was 29.52M at snapshot time against an average of about 32.11M, with the session still open.
Market breadth and new highs / lows
- NYSE: 1,521 advancers vs 652 decliners. Nasdaq: 1,792 vs 1,293 (Finviz, intraday). Advancers lead on both, so Oracle is falling against the tape.
- About 40.5% of US stocks were above their 50-day average and 40.7% above their 200-day (Finviz, all US stocks, not the S&P 500 only).
- New 52-week highs vs lows across US stocks (Finviz, intraday): 166 vs 248, so lows lead.
Fundamentals
- Sector / Industry
- Technology Services / Packaged Software
- Analyst Consensus
- Buy (41 analysts)
- Avg. Price Target
- ~$234-241 (+91% to +96%)
- P/E (TTM / Fwd)
- 19.2x / 11-14x (sources differ)
- Revenue (TTM)
- $71.78B
- Growth Q/Q
- Sales +29.6% / EPS +55.0%
- Beta
- 1.78 (high market sensitivity)
- Next Earnings
- In about 42 days
Volatility snapshot (Options Swing Helper)
- Expected Move (30d)
- ±$30.33 (±24.7%)
- 1 SD Range
- $92.45 - $153.11
- HV Rank (Ann. HV)
- 71.04% (71.6%)
- Premium
- Rich
The expected move and 1 SD range come from the Options Swing Helper indicator on the chart; they describe how far the market is pricing the stock to move over 30 days, not where it will go.
Our read: Bearish (Mixed)
The reading is bearish but mixed. Price is below its 21, 50 and 100 EMAs and about 22% below its 200-day average, and Investing.com's technical summary is Strong Sell. RSI is 40.3, not oversold, while its Stochastic is 6.1, which is. The chart's MACD sits above its signal line even though the trend is down. Against that, sales grew 29.6% and EPS 55.0% quarter on quarter, 41 analysts rate the stock a Buy with an average target of about $234 to $241, and the forward P/E is about 11 to 14. Beta is 1.78, so the stock moves more than the market, and the Options Swing Helper shows option premium as rich (HV Rank 71.04%). Oracle is falling while advancers lead the market. The levels to watch are today's low near $121.50 and the 52-week low of $114.50 on the downside, and the 21 EMA near $133.79 on the upside.
Not investment advice, illustrative and educational only.
Learn how to read this
- Options Swing Helper : the free TradingView indicator behind the expected-move cone and HV Rank
- Free options lessons : contracts, the Greeks, income strategies and volatility
- Bullish, bearish and VIX : terms used in these reports
- Signal Desk : research any stock and practice with a paper-trading account