
Daily chart analysis · November 5, 2026
NVIDIA Corporation (NVDA) stock analysis: November 5, 2026
Intraday snapshot, Thu Nov 5, 2026 at 11:05 AM (UTC-7). Not a closing price.
Educational content only, not investment advice. Chart readings are snapshots taken at the time shown, not closing prices, and nothing here predicts where a stock will go.
Why NVDA today
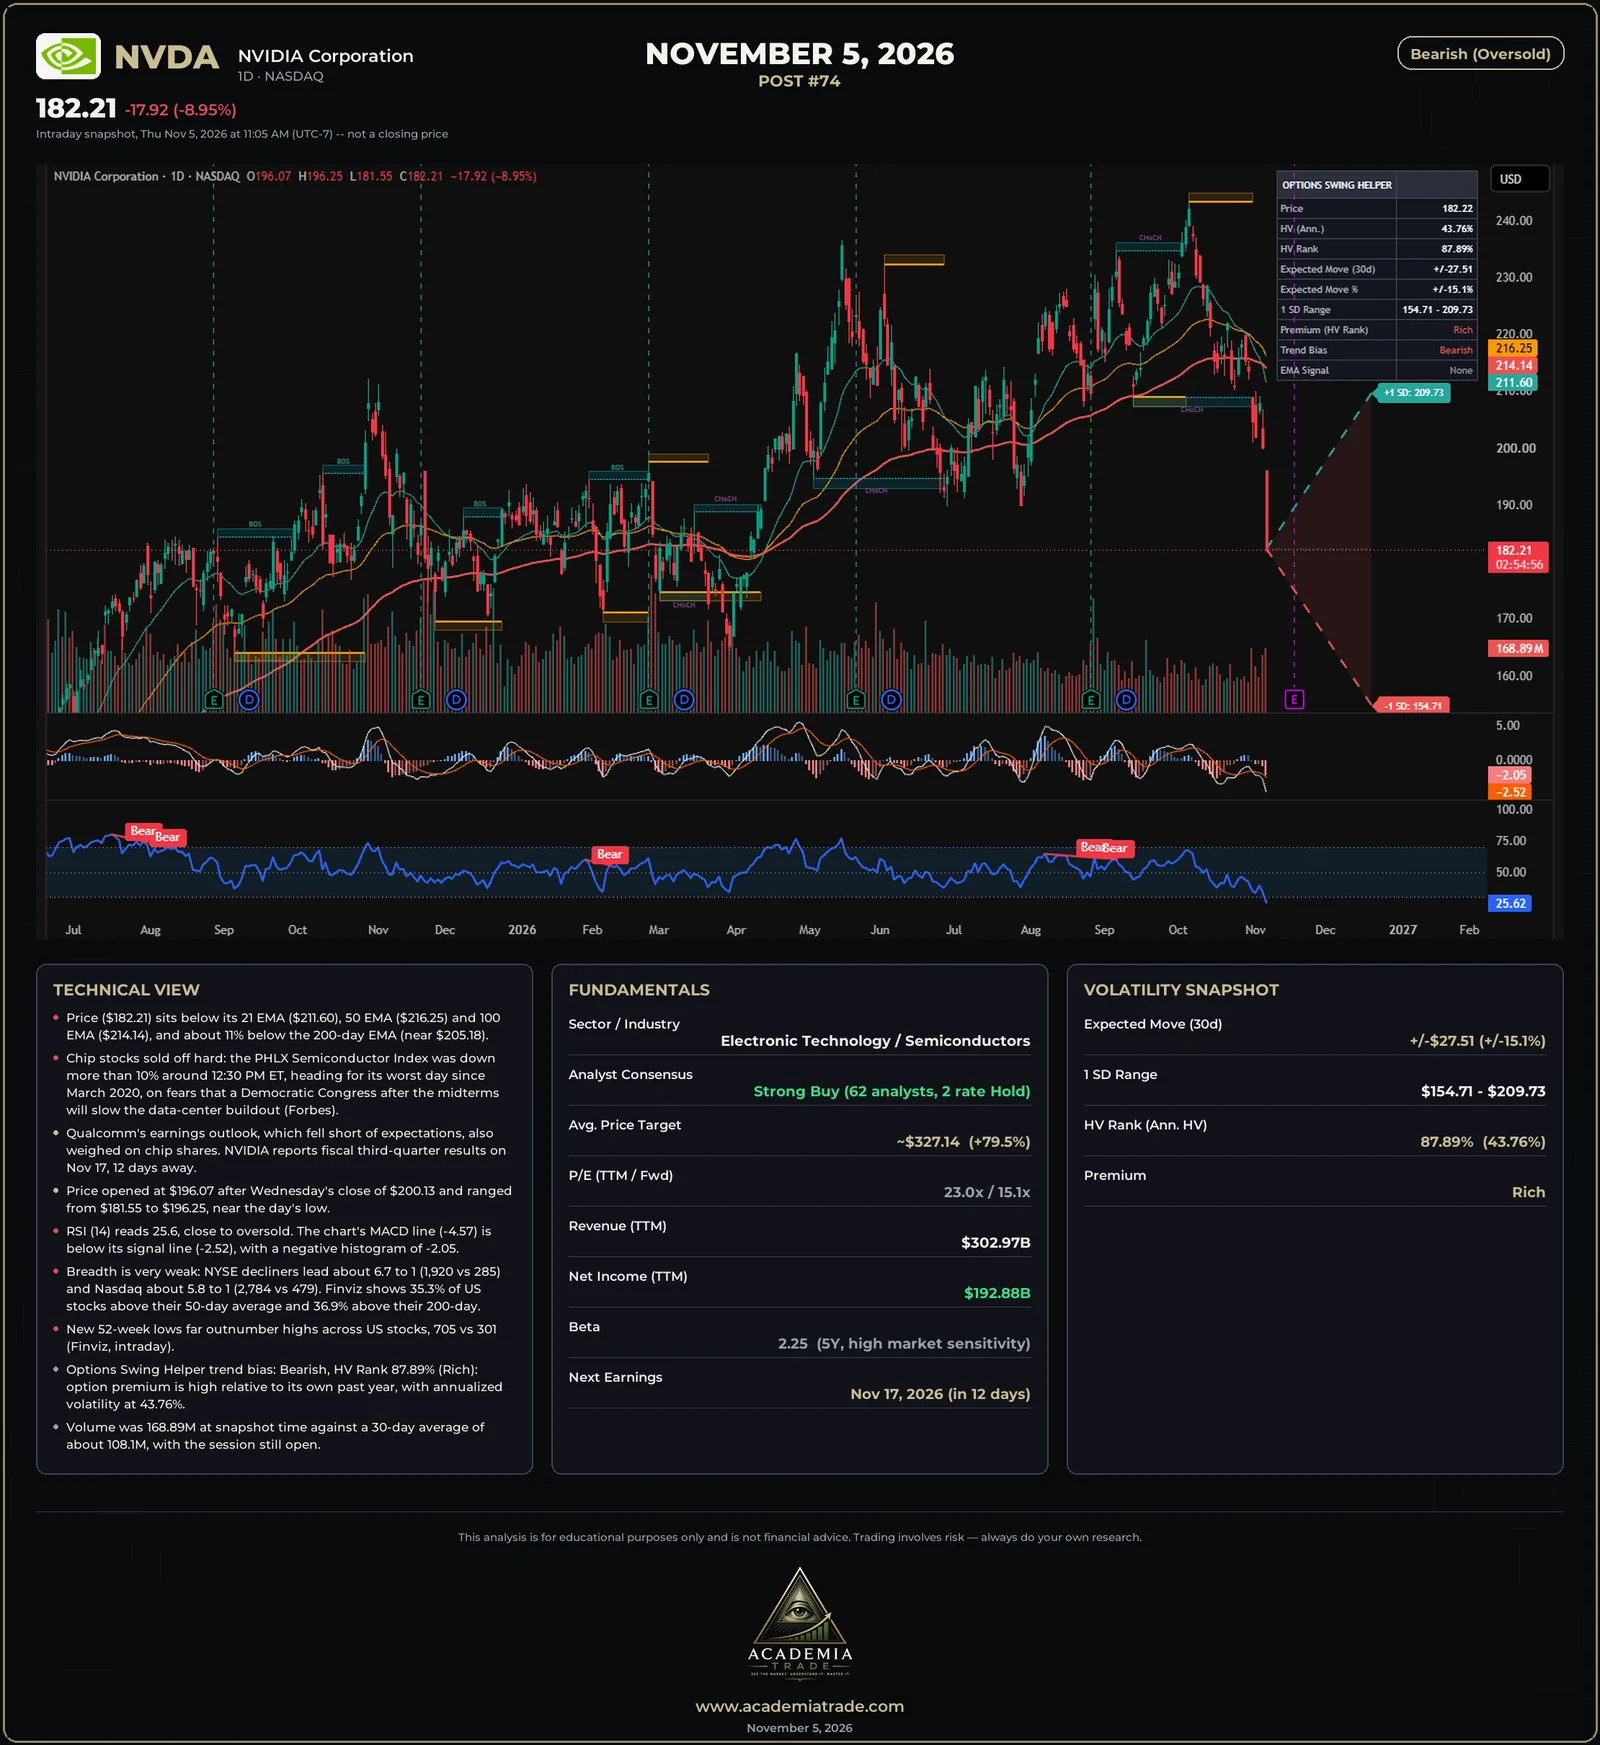
NVIDIA fell about 9% on Thursday as chip stocks sold off for a second day. The PHLX Semiconductor Index was down more than 10% around midday, on track for its worst day since March 2020, as investors worried that Democratic control of Congress after the midterm elections will slow the data-center buildout that drives chip demand. Qualcomm's earnings outlook, which fell short of expectations, added to the pressure on the group. NVIDIA is about 25% below its October high and reports fiscal third-quarter results on November 17.
Technical view
- Price ($182.21) sits below its 21 EMA ($211.60), 50 EMA ($216.25) and 100 EMA ($214.14), and about 11% below the 200-day EMA (near $205.18).
- Chip stocks sold off hard: the PHLX Semiconductor Index was down more than 10% around 12:30 PM ET, heading for its worst day since March 2020, on fears that a Democratic Congress after the midterms will slow the data-center buildout (Forbes).
- Qualcomm's earnings outlook, which fell short of expectations, also weighed on chip shares. NVIDIA reports fiscal third-quarter results on Nov 17, 12 days away.
- Price opened at $196.07 after Wednesday's close of $200.13 and ranged from $181.55 to $196.25, near the day's low.
- RSI (14) reads 25.6, close to oversold. The chart's MACD line (-4.57) is below its signal line (-2.52), with a negative histogram of -2.05.
- Breadth is very weak: NYSE decliners lead about 6.7 to 1 (1,920 vs 285) and Nasdaq about 5.8 to 1 (2,784 vs 479). Finviz shows 35.3% of US stocks above their 50-day average and 36.9% above their 200-day.
- New 52-week lows far outnumber highs across US stocks, 705 vs 301 (Finviz, intraday).
- Options Swing Helper trend bias: Bearish, HV Rank 87.89% (Rich): option premium is high relative to its own past year, with annualized volatility at 43.76%.
- Volume was 168.89M at snapshot time against a 30-day average of about 108.1M, with the session still open.
Market breadth and new highs / lows
- NYSE: 285 advancers vs 1,920 decliners, about 6.7 to 1 negative. Nasdaq: 479 vs 2,784, about 5.8 to 1 negative (midday).
- About 35.3% of US stocks were above their 50-day average and 36.9% above their 200-day (Finviz, all US stocks, not the S&P 500 only, 1:07 PM ET).
- New 52-week highs vs lows across US stocks (Finviz, intraday): 301 vs 705, so lows lead.
Fundamentals
- Sector / Industry
- Electronic Technology / Semiconductors
- Analyst Consensus
- Strong Buy (62 analysts, 2 rate Hold)
- Avg. Price Target
- ~$327.14 (+79.5%)
- P/E (TTM / Fwd)
- 23.0x / 15.1x
- Revenue (TTM)
- $302.97B
- Net Income (TTM)
- $192.88B
- Beta
- 2.25 (5Y, high market sensitivity)
- Next Earnings
- Nov 17, 2026 (in 12 days)
Volatility snapshot (Options Swing Helper)
- Expected Move (30d)
- ±$27.51 (±15.1%)
- 1 SD Range
- $154.71 - $209.73
- HV Rank (Ann. HV)
- 87.89% (43.76%)
- Premium
- Rich
The expected move and 1 SD range come from the Options Swing Helper indicator on the chart; they describe how far the market is pricing the stock to move over 30 days, not where it will go.
Our read: Bearish (Oversold)
The reading is bearish and deeply oversold. Price is below its 21, 50 and 100 EMAs and about 11% under its 200-day EMA, RSI is 25.6, and the chart's MACD sits below its signal line. The selloff is sector-wide: the semiconductor index was down more than 10% at midday on fears of a slower data-center buildout, and breadth is about 6 to 1 negative on both exchanges. Against that, 62 analysts rate the stock a Strong Buy with an average target near $327, the trailing P/E is about 23 (forward about 15) and the company reports earnings on November 17. Beta is 2.25 and the Options Swing Helper shows option premium as rich (HV Rank 87.89%), so moves can stay large in both directions. The levels to watch are today's low near $181.55 and the 1 SD low near $154.71 on the downside, and Wednesday's close near $200.13 on the upside.
Not investment advice, illustrative and educational only.
Learn how to read this
- Options Swing Helper : the free TradingView indicator behind the expected-move cone and HV Rank
- Free options lessons : contracts, the Greeks, income strategies and volatility
- Bullish, bearish and VIX : terms used in these reports
- Signal Desk : research any stock and practice with a paper-trading account